Daily News 18 10 2024

Important News of the Day

Zaman Önem Ülke Olay Beklenen Önceki Açıklanan
00:10 USA (USD) Fed Waller Speaks
02:00 England (GBP) Core Retail Sales (MoM) (Sep) -0.3% 1.1%
02:00 England (GBP) Core Retail Sales (YoY) (Sep) 3.2% 2.3%
08:30 USA (USD) Building Permits (Sep) 1.450M 1.470M
09:00 USA (USD) FOMC Member Bostic Speaks

Markets are pricing in Trump win, surging GOP sweep probability: JPMorgan

image

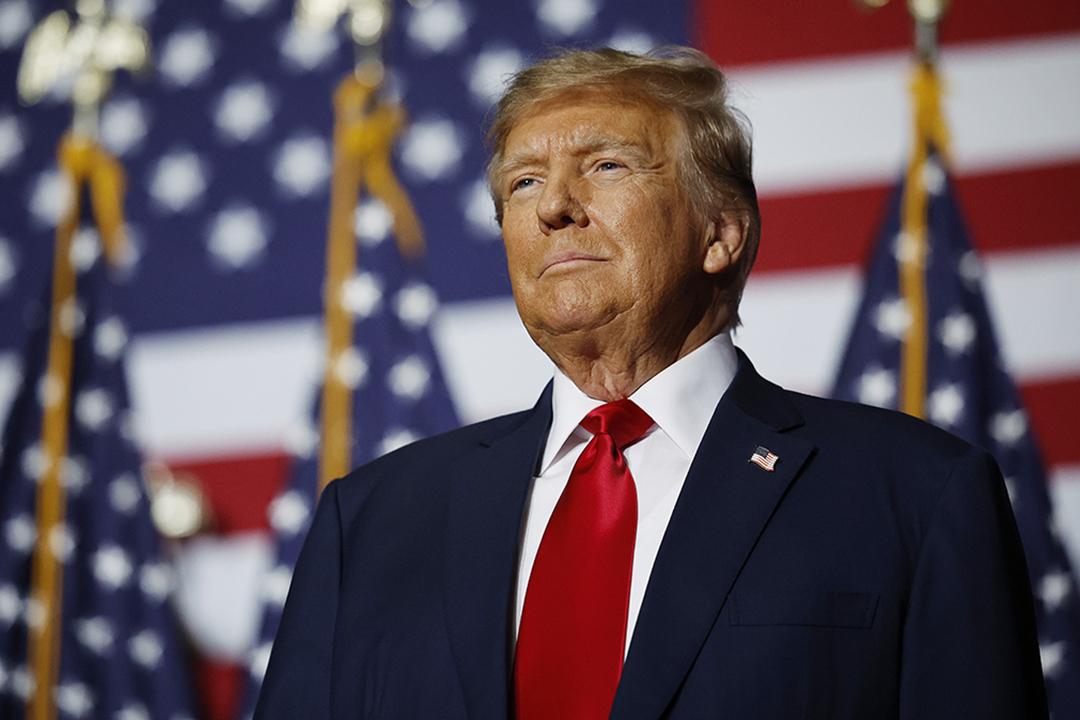
Markets are beginning to price in the so-called "Trump trade,” with betting odds increasingly favoring a Republican sweep in the upcoming elections, JPMorgan strategists said.

Specifically, the probability of President Trump's re-election has risen to 56% according to betting markets, while the likelihood of a Republican-controlled Senate has surpassed 80%, with expectations of three seats changing hands.

At the same time, the odds of a Democratic majority in the House have decreased from over 60% to around 55%.

The rising probability of a Republican sweep has also been reflected in recent market movements over the past two weeks, including stronger U.S. equities—particularly in the banking sector—a strengthening dollar, tighter credit spreads, and higher yields on U.S. Treasury securities.

That said, "we do not believe that the probability of a Republican sweep embedded in markets at the moment is as high as the around 45% currently implied by betting odds,” JPMorgan strategists said in a note.

The strategists argue that if the "Trump trade" is considered similarly to its manifestation in 2016—characterized by higher Treasury yields, a stronger dollar, U.S. equities outperforming international markets, banking sector outperformance, and tighter credit spreads—the recent market shifts have been modest.

Although current asset performances suggest a significantly higher probability of a Trump victory compared to two weeks ago, markets are still “a long way from fully pricing the 2016 experience,” strategists note.

"In other words, while markets have now begun to price in a more significant probability of a Republican sweep, we believe that there are still some way from even pricing the around 45% probability implied by betting odds, let alone from fully pricing in a Republican sweep," they wrote.

ECB survey shows quicker return of inflation to target

image

FRANKFURT (Reuters) - Euro zone inflation could return to the European Central Bank's 2% target sooner than earlier thought and will likely hover around this level even in the longer term, a fresh ECB survey showed on Friday.

The ECB lowered interest rates for the third time this year on Thursday on moderating price pressures and investors now see rate cuts at each of its next four or five meetings as inflation is within striking distance of 2%.

Economists in the ECB's Survey of Professional Forecasters now see inflation next year at 1.9%, below the 2% predicted three months ago, and see it holding at 1.9% in 2026.

This is somewhat quicker than the ECB's own forecast, which puts inflation back at target only in the final quarter of 2025, and sees the year's average at 2.3%.

In the longer term, defined as 2029, inflation is seen at 2.0%, right on the ECB's target.

The bank has spent the past three years fighting the worst bout of inflation in over a generation but some policymakers now think there is a realistic risk the bank could return to undershooting 2%.

Forecasts for underlying inflation, a key concern for policymakers because of rapid price growth in services, was unchanged at 2.2% in 2025 and 2.0% in 2026.

The survey, an important input in the ECB's policy deliberations, also predicted economic growth at 1.2% next year, below the 1.3% seen earlier, which would then accelerate to 1.4% in the following year.

China GDP grows as expected in Q3, remains below 5% annual target

image

The Chinese economy grew as expected in the third quarter, gross domestic product data showed on Friday, although the economy’s pace of growth remained below Beijing’s annual target.

Chinese GDP grew 4.6% year-on-year in the three months to September 30 in line with expectations but slowing from the 4.7% seen in the prior quarter.

GDP grew 0.9% quarter-on-quarter, slightly missing expectations of 1%.

This brought year-to-date GDP growth to 4.8%, still below Beijing’s 5% annual target.

Beijing announced a string of stimulus measures in the past three weeks, marking China’s most concentrated efforts yet to shore up sluggish economic growth. A sustained deflationary trend, weak private spending and a prolonged property market crash have been the biggest weights on the Chinese economy in recent years.

Recent stimulus, however, sparked mixed sentiments towards the economy, given that Beijing did not provide key details on the timing and scope of the planned measures.

Still, the Chinese government said the economy remained on track to achieve its 5% annual target. The government also announced targeted measures to support the property market, as well as plans to improve the debt positions of local governments.

Separate data on Friday showed China’s industrial production and retail sales both grew more than expected in September, while the country’s unemployment rate fell to 5.1% against expectations it would remain at 5.3%.

Gold prices hit record high above $2,700 on election uncertainty, rate cut hopes

image

Gold prices hit a record high in Asian trade on Friday, benefiting from safe haven demand with just weeks left to a closely contested U.S. presidential election, while an interest rate cut by the European Central Bank also helped.

Spot gold rose 0.4% to a record high of $2,705.26 an ounce, while gold futures expiring in December rose 0.5% to $2,720.15 an ounce.

The yellow metal firmed even as strong U.S. retail sales and labor market data furthered bets that U.S. interest rates will fall at a slower pace in the coming months.

Gold buoyed by pre-election safe haven demand Bullion prices broke out of a tight trading range seen in the past two weeks, hitting new peaks as the U.S. election approached.

Recent polls showed Vice President Kamala Harris and former president Donald Trump set for a tight presidential race, with less than three weeks left to the ballot.

The disparity in the stances of both candidates spurred increased uncertainty over what the results of the election will entail.

While media polls showed Harris with a small lead over Trump, prediction and betting markets largely leaned towards a Trump victory, sparking more uncertainty over the potential outcome.

Gold was also favored by safe haven demand as the Middle East conflict raged on. Traders were bracing for Israel’s retaliation against Iran over an early-October attack.

Gold brushes off stronger dollar The yellow metal firmed despite pressure from a stronger dollar, as the greenback hit an over 2-½ month high this week.

European stock markets edged lower Friday, as investors digested the latest ECB interest rate cut as well as growth data from China, the world’s second-largest economy.

image

At 03:40 ET (08:40 GMT), the DAX index in Germany traded 0.1% lower, the CAC 40 in France fell 0.1% and the FTSE 100 in the U.K. dropped 0.4%.

ECB cuts interest rates again The European Central Bank cut interest rates on Thursday by 25 basis points to 3.25%, following on from September’s move - the first back-to-back rate cut since 2011.

Although this reduction was widely expected, the quickening pace of rate cuts points to a worsening economic outlook amid signs that inflation is increasingly under control.

There was some good economic news in Europe Friday, after data showed that UK retail sales rose 0.3% on the month in September, annual growth of 3.9%.

This compares with expectations for a monthly fall of 0.3%, and a year-on-year gain of 3.2%.

Additionally, gross domestic product data showed the Chinese economy grew 4.6% in the third quarter, largely as expected although the economy’s pace of growth remained below Beijing’s annual target.

This brought year-to-date GDP growth to 4.8%, still below Beijing’s 5% annual target.

Crude on track for weekly losses Oil prices edged higher Friday, but remained on track for their biggest weekly loss in more than a month on concerns about demand.

By 03:05 ET, the Brent contract climbed 0.4% to $74.73 per barrel, while U.S. crude futures (WTI) traded 0.5% higher at $71.00 per barrel.

Both benchmarks settled higher on Thursday for the first time in five sessions after data showed that official US inventories fell last week, but are still set to fall about 6% this week, their biggest weekly decline since Sept. 2.

Both OPEC and the International Energy Agency cut their forecasts for global oil demand earlier this week, adding to ongoing concerns about demand growth, largely centered around China.

EURUSD

Daily Newsletter

While the ECB's interest rate decision aligned with market expectations, President Lagarde's data-driven messages are drawing attention. During this process, positive retail sales data from the U.S. contributes to the strengthening of the dollar index, exerting pressure on the EURUSD and GBPUSD pairs. Data from the UK and U.S. economies and statements from Fed officials could trigger new pricing in the markets. The dollar index continues its positive trajectory above the 34-day average, maintaining its negative pressure on the pairs. From a technical perspective on the EURUSD pair, the 1.0888-1.0900 range forms a significant resistance area. As long as the pair remains below this level, weakness and a strong trend theme may continue. On the downside, 1.0828, 1.0780, and 1.0735 levels should be monitored as support. The RSI indicator is at 32.33 and is trending near the oversold territory. The current price is 1.0831, showing a 0.28% decline from the previous day. In case of a recovery, the 34-period average poses a significant barrier, while the main negative outlook remains below the 1.0992-1.1006 levels. Support:1.0828 - 1.078 - 1.0735 - Resistance:1.087 - 1.09 - 1.094 -

ECB'nin faiz kararı piyasa beklentisi doğrultusunda gerçekleşirken, Başkan Lagarde'ın veri odaklı mesajları dikkat çekiyor. Bu süreçte, ABD'den gelen olumlu perakende satışlar verisi dolar endeksinin güçlenmesine katkıda bulunarak EURUSD ve GBPUSD paritelerinde baskı oluşturuyor. İngiltere ve ABD ekonomilerinden gelecek veriler ve Fed yetkililerinin açıklamaları, piyasalarda yeni fiyatlamaları tetikleyebilir. Dolar endeksi, 34 günlük ortalamanın üzerinde pozitif seyrini sürdürürken, bu durum pariteler üzerinde negatif bir baskı yaratmaya devam ediyor. EURUSD paritesi, teknik açıdan incelendiğinde, 1.0888-1.0900 bölgesi önemli bir direnç alanı oluşturuyor. Paritenin bu seviye altında kalmayı sürdürdüğü müddetçe zayıflık ve güçlü trend teması devam edebilir. Aşağıda 1.0828, 1.0780 ve 1.0735 seviyeleri destek olarak izlenmeli. RSI göstergesi 32.33 seviyesinde olup aşırı satım bölgesine yakın bir seyir izlemekte. Anlık fiyat 1.0831 ve önceki güne göre %0.28'lik bir düşüş gözleniyor. Toparlanma durumunda 34 periyotluk ortalama önemli bir bariyer teşkil ederken, 1.0992-1.1006 seviyelerinin altındaki ana negatif görünüm korunuyor. Destek:1.0828 - 1.078 - 1.0735 - Direnç:1.087 - 1.09 - 1.094 -

GBPUSD

Daily Newsletter

The GBP/USD pair continues to be pressured due to the increase in the dollar index following the interest rate adjustments by the European Central Bank and positive retail sales data from the US. The dollar index showcases a positive outlook above the 34-day average while moving above the 233-day average, creating negative effects on many pairs including GBP/USD. Upcoming retail sales data from the UK and building permits data from the US could influence the pair's trajectory. Additionally, interest rate moves in the upcoming BOE and Fed meetings may steer pricing in the swap markets. Technically, the GBP/USD pair is currently trading at the 1.3019 level, which is 0.23% above yesterday's closing price of 1.2989. The pair may encounter resistance at the 1.303 and 1.308 levels, while downward movements should watch the 1.298, 1.294, and 1.29 levels for support. The RSI indicator is at 46.47, indicating a neutral market outlook. The market direction should be closely monitored to see whether the pair will test the mentioned support levels or break above the resistance levels. Support:1.298 - 1.294 - 1.29 - Resistance:1.303 - 1.308 - 1.3135 -

GBP/USD paritesi, Avrupa Merkez Bankası'nın yaptığı faiz düzenlemeleri ve ABD'den gelen olumlu perakende satışlar verisi sonrası dolar endeksindeki artışla baskı altında kalmaya devam ediyor. Dolar endeksi, 34 günlük ortalama üzerinde pozitif görünüm sergilerken, 233 günlük ortalama üzerinde hareket ederek GBP/USD dahil olmak üzere birçok parite üzerinde negatif etkiler yaratıyor. İngiltere'den gelecek perakende satışlar ve ABD'den inşaat izinleri verileri paritenin seyrini etkileyebilir. Ayrıca, BOE ve Fed'in ilerleyen toplantılarında faiz hareketleri swap piyasasındaki fiyatlamaları yönlendirebilir. Teknik olarak, GBP/USD paritesi şu an 1.3019 seviyesinden işlem görüyor ve dünkü kapanış fiyatı olan 1.2989’dan %0.23 yukarıda. Parite, 1.303 ve 1.308 seviyelerinde dirençle karşılaşabilir, aşağı yönlü hareketlerde ise 1.298, 1.294 ve 1.29 seviyeleri destek olarak izlenmekte. RSI göstergesi 46.47 seviyesinde bulunuyor, bu da nötr bir piyasa görünümüne işaret ediyor. Paritenin, belirttiğimiz destek seviyelerini test edip etmeyeceği veya direnç seviyelerinin üzerine çıkıp çıkmayacağı, piyasaların yönünü belirlemek adına yakından izlenmelidir. Destek:1.298 - 1.294 - 1.29 - Direnç:1.303 - 1.308 - 1.3135 -

USDTRY

Daily Newsletter

The Turkish Lira is among the currencies that are weak against the US Dollar among emerging market countries. The European Central Bank's decision to cut interest rates and the strong retail sales data from the US have supported the dollar's appreciation. A mixed outlook prevails in Asian markets. These developments continue to exert pressure on the Turkish Lira. The USD/TRY pair is trading near the 34.20 level, and the strong trend of the dollar index is creating a negative pressure on the TL. Technically, the USD/TRY pair is trading just above the 34.16 support on the 4- hour chart. In upward movements, the levels of 34.23, 34.30, and 34.34 should be monitored as resistance. The RSI indicator is at 48, displaying a neutral outlook. The pair has increased by 0.12% compared to the previous day. Support levels are at 34.16, 34.09, and 34.02, and breaking below these levels could deepen the corrective selling. However, if the exchange rate surpasses the aforementioned resistance levels, the upward momentum could strengthen. Support:34.16 - 34.09 - 34.02 - Resistance:34.23 - 34.3 - 34.34 -

Türk Lirası, gelişmekte olan ülkeler arasında ABD Doları karşısında zayıf seyreden para birimleri arasında yer alıyor. Avrupa Merkez Bankası'nın faiz indirim kararı ve ABD'deki perakende satışların güçlü gelmesi, dolar üzerindeki değer artışını destekledi. Asya piyasalarında ise karışık bir görünüm hakim. Bu gelişmeler Türk Lirası üzerinde baskı yaratmaya devam ediyor. USD/TRY paritesi 34,20 seviyesine yakın işlem görüyor ve dolar endeksinin güçlü seyri TL üzerinde negatif bir baskı oluşturuyor. Teknik olarak, USD/TRY paritesi 4 saatlik grafikte 34,16 desteğinin hemen üzerinde işlem görüyor. Yukarı yönlü hareketlerde 34,23, 34,30 ve 34,34 seviyeleri direnç olarak izlenmeli. RSI göstergesi 48 seviyesinde ve nötr bir görünüm sergiliyor. Parite, önceki güne göre %0,12 oranında artmış durumda. Destek seviyeleri 34,16, 34,09 ve 34,02 olup, bu seviyelerin aşağı yönlü kırılması durumunda tepki satışları derinleşebilir. Ancak, kur yukarıda belirtilen direnç seviyelerini aşarsa, yükseliş ivmesi güç kazanabilir. Destek:34.16 - 34.09 - 34.02 - Direnç:34.23 - 34.3 - 34.34 -

XAUUSD

Daily Newsletter

Gold has gained value as the Dollar index restricts its upward trend and the European Central Bank's interest rate cut decision. The upward pressure on gold prices in the markets is increasing due to Israel's attack on Hamas leader Yahya Sinvar and expectations of a Fed interest rate cut in November. In addition to these developments, the speeches by FOMC member Waller during the day could also be decisive in the price movements of the precious metal. Technically, it appears that gold is limiting its downward trend in the 2680 - 2690 range. As long as it stays above this range, the positive outlook is likely to continue. On the chart, short-term indicators supporting upward movement in prices may target the resistance levels of 2710 and 2720. Gold prices are currently at the 2711.40 level, showing a 2.50% increase compared to the previous day. While the 2700 and 2690 levels are monitored as support, the resistance levels of 2720 and 2730 could be significant if the upward movement continues. The RSI indicator is at 76, indicating an overbought zone and confirming that the market is progressing positively. However, in the event of a possible pullback, attention should be paid to the 2680 - 2690 range; a sustained break below these levels could open the way for lower targets. Support:2700 - 2690 - 2685 - Resistance:2710 - 2720 - 2730 -

Ons altın, Dolar endeksinin yükseliş eğilimini sınırlandırması ve Avrupa Merkez Bankası'nın faiz indirim kararıyla birlikte değer kazandı. İsrail'in Hamas lideri Yahya Sinvar'a gerçekleştirdiği saldırı ve Fed’in Kasım ayında faiz indirimine yönelik beklentilerin etkisiyle, piyasalarda altın fiyatları üzerindeki yukarı yönlü baskı artıyor. Bu gelişmelerin yanında, FOMC üyesi Waller'ın gün içindeki konuşmaları da değerli metalin fiyat hareketlerinde belirleyici olabilir. Teknik olarak, altının 2680 - 2690 bölgesinde düşüş eğilimini sınırladığı görülüyor. Bu bölgenin üzerinde kalındığı sürece pozitif görünümün sürmesi muhtemel. Grafikte, fiyatların yukarı yönlü hareketi destekleyen kısa vadeli göstergeler, 2710 ve 2720 direnç seviyelerini hedefleyebilir. Altın fiyatları şu anda 2711.40 seviyesinde bulunuyor ve önceki güne göre %2.50 artış göstermiş durumda. 2700 ve 2690 seviyeleri destek olarak izlenirken, yukarı yönlü hareketin devam etmesi durumunda 2720 ve 2730 direnç seviyeleri önemli olabilir. RSI göstergesi ise 76 seviyesinde, bu da aşırı alım bölgesine işaret edip, piyasanın olumlu yönde ilerlediğini doğruluyor. Ancak, olası bir geri çekilmede 2680 - 2690 aralığına dikkat edilmesi, bu seviyelerin altında kalıcı bir kırılmanın daha aşağı hedeflerin önünü açabileceğini gösteriyor. Destek:2700 - 2690 - 2685 - Direnç:2710 - 2720 - 2730 -

WTIUSD

Daily Newsletter

Oil prices continue to fluctuate due to concerns about supply from the Middle East not yet coming into play and weakness in global demand expectations. Additionally, the European Central Bank's interest rate cut and better-than-expected retail sales in the US have strengthened the dollar index, which could affect oil price movements. The mixed trend in Asian markets and changes in US 10-year bond yields may indirectly impact the trajectory of WTI. Technically, when the WTIUSD chart is examined on an hourly timeframe, it is observed that the price faces resistance at the 70.5 level. The current price is at 70.737, showing a 0.89% increase compared to the previous day's price. As long as it stays above the 70 level, the upward trend is expected to continue. In downward movements, the levels of 70, 69.5, and 69 can be monitored as short-term support points. The RSI indicator is at 58, displaying a positive outlook, indicating a slight increase in buying appetite. However, for a stronger rise, it may be important to see closings above the 71 level. Support:70 - 69.5 - 69 - Resistance:70.5 - 71 - 71.5 -

Petrol fiyatları, Orta Doğu'daki arz endişelerinin henüz devreye girmemesi ve küresel talep beklentilerindeki zayıflık nedeniyle dalgalı bir seyir izlemeye devam ediyor. Buna ek olarak, Avrupa Merkez Bankası'nın faiz indirimi ve ABD'de perakende satışların beklenenden iyi gelmesi, dolar endeksinin güç kazanmasına neden oldu ve bu durum, petrol fiyatlarının hareketlerini etkileyebilecek bir gelişmeydi. Asya borsalarının karışık seyri ve ABD 10 yıllık tahvil faizlerindeki değişimler, WTI'nin seyrine dolaylı etki edebilir. Teknik olarak WTIUSD grafiği saatlik zaman diliminde incelendiğinde, fiyatın 70.5 seviyesindeki dirençle karşılaştığı görülüyor. Anlık fiyat 70.737'de olup, önceki günün fiyatına göre %0.89 artış göstermiş durumda. 70 seviyesinin üzerinde kaldığı sürece, alıcılı seyrin devam edebileceği düşünülüyor. Aşağı yönlü hareketlerde 70, 69.5 ve 69 seviyeleri kısa vadeli destek noktaları olarak izlenebilir. RSI göstergesi 58 seviyesinde ve pozitif bir görünüm sergiliyor, bu da alım iştahının bir miktar arttığına işaret ediyor. Ancak, daha güçlü bir yükseliş için 71 seviyesinin üzerinde kapanışların görülmesi önem taşıyabilir. Destek:70 - 69.5 - 69 - Direnç:70.5 - 71 - 71.5 -

BRNUSD

Daily Newsletter

Crude oil futures have been trading flat in recent days due to potential risks related to supply in the Middle East not yet materializing and weakness in demand expectations. The dollar strengthened following the European Central Bank's interest rate cut and strong retail sales data from the U.S. While no changes are expected in U.S. interest rates, leading data for future meetings are being watched closely. In Asian markets, a mixed outlook prevails. The Japanese Nikkei index remains stable, while increases in the Hang Seng and Shanghai indices stand out. From a technical analysis perspective, the BRN/USD pair is trading at the 74.31 level on the hourly timeframe, showing a 5.92% increase compared to the previous day. The levels of 74.00 and 73.50 are being monitored as support, while resistance levels of 75.00, 75.50, and 76.00 should be followed. The RSI indicator is at the 55.47 level, presenting a positive outlook, which could strengthen the potential for upward movements. However, if there are no closes above the 75.00 resistance, a new potential for decline could emerge. Support:74 - 73.5 - 73 - Resistance:75 - 75.5 - 76 -

Petrol vadeli işlemleri, Orta Doğu'daki arzla ilgili potansiyel risklerin henüz gerçekleşmemesi ve talep beklentilerindeki zayıflık sebebiyle son günlerde yatay bir seyir izliyor. Avrupa Merkez Bankası'nın faiz indirmesi ve ABD'den gelen güçlü perakende satış verileri sonrası dolar güçlendi. ABD faiz oranlarında değişiklik beklenmese de ileriye dönük toplantılar için öncü veriler dikkatle takip ediliyor. Asya piyasalarında ise karışık bir görünüm hakim. Japon Nikkei endeksi sabit seyrederken, Hang Seng ve Shanghai endekslerindeki artış dikkat çekiyor. Teknik analiz açısından, BRN/USD paritesi saatlik zaman diliminde 74.31 seviyesinde işlem görüyor ve bir önceki güne kıyasla %5.92 artış göstermiş. Paritede 74.00 ve 73.50 seviyeleri destek olarak izlenirken, 75.00, 75.50 ve 76.00 direnç seviyeleri takip edilmeli. RSI göstergesi 55.47 seviyesinde ve pozitif bir görünüm sergiliyor, bu da yukarı yönlü hareketlerin potansiyelini güçlendirebilir. Ancak 75.00 direncinin üzerinde kapanışlar olmazsa, yeni bir düşüş potansiyeli ortaya çıkabilir. Destek:74 - 73.5 - 73 - Direnç:75 - 75.5 - 76 -

NDXUSD

Daily Newsletter

The NASDAQ 100 index rose with support from the technology sector following the better-than-expected earnings of Netflix and TSMC. However, the increase in 10-year treasury yields after retail sales data in the US surpassed expectations limited the upward movement in the index. The European Central Bank's decision to cut interest rates and the rise in US retail sales led to a gain in the dollar's value in the markets, resulting in a mixed picture across global indices. Additionally, the construction permits data scheduled for release today, along with the speeches from FOMC member Waller, may lead to market volatility. Technically, the NASDAQ 100 index is at a decision stage moving between 20250-20500 on the daily chart. To maintain its positive outlook, a sustained move above the 20500 resistance may be necessary. In upward movements, the resistance levels at 20650 and 20750 should be closely watched. However, if the 20250 support is breached, a pullback towards 20150 and 20000 levels may occur. Among the technical indicators, the RSI is showing a neutral outlook at the 48.72 level, reflecting market uncertainties. The current price stands at 20231.5, indicating a 0.77% decline compared to the previous day. Support:20250 - 20150 - 20000 - Resistance:20500 - 20650 - 20750 -

NASDAQ 100 endeksi, Netflix ve TSMC'nin beklentiler üzerinde gelen bilançolarının ardından teknoloji sektöründen aldığı destekle yükselirken, ABD'de beklenenden iyi sonuçlanan perakende satışlar verisinin ardından 10 yıllık hazine tahvil faizlerindeki artışlar, endekste yukarı yönlü hareketin sınırlanmasına neden oldu. Avrupa Merkez Bankası'nın faiz indirim kararı ve ABD'nin perakende satışlardaki artışları, piyasalarda doların değer kazanmasına, dolayısıyla küresel endekslerde karışık bir tabloya sebep oldu. Ayrıca, gün içerisinde açıklanacak inşaat izinleri verileri ve FOMC üyesi Waller’ın konuşmaları, piyasalarda volatiliteye yol açabilir. Teknik açıdan NASDAQ 100 endeksi, günlük grafikte 20250-20500 arasında karar aşamasında hareket ediyor. Endeksin pozitif görünümünü sürdürebilmesi için 20500 direncinin üzerinde kalıcı bir hareket gerekebilir. Yukarı yönlü hareketlerde 20650 ve 20750 direnç seviyeleri dikkatle izlenmelidir. Ancak, 20250 desteğinin altına inildiğinde 20150 ve 20000 seviyelerine doğru bir geri çekilme görülebilir. Teknik göstergelerden RSI, 48.72 seviyesinde nötr görünüm sergiliyor ve piyasadaki belirsizlikleri yansıtıyor. Anlık fiyat 20231.5 seviyesinde, önceki güne göre 0.77% düşüş göstermektedir. Destek:20250 - 20150 - 20000 - Direnç:20500 - 20650 - 20750 -

DAXEUR

Daily Newsletter

DAXEUR is moving with cautious optimism amid developments in global markets. The European Central Bank’s decision to cut interest rates and strong retail sales data from the US are supporting an upward movement in the dollar index. This situation is also having a positive impact on the DAX index. The mixed performance of global markets, especially in Asia and the US, does not exert significant pressure on DAXEUR. However, upcoming economic data from the UK and the US, along with statements from Fed officials, could be decisive for determining the direction of DAXEUR in the future. From a technical standpoint, DAXEUR is currently at the level of 19,555, showing a 0.17% increase compared to the previous day's close. The chart is on a 4-hour timeframe. Rally situations are concentrating at the 19,660 resistance level, and further upward movement may lead to testing the 19,755 and 19,850 levels. Conversely, the support levels of 19,545, 19,465, and 19,350 should be monitored. The RSI indicator is at the 49.92 level, indicating a neutral perspective. This suggests that prices could move in a balanced manner and potentially follow a sideways trend within the current price channel. Support:19545 - 19465 - 19350 - Resistance:19660 - 19755 - 19850 -

DAXEUR, küresel piyasalardaki gelişmelerle birlikte temkinli bir iyimserlik içinde hareket ediyor. Avrupa Merkez Bankası'nın faiz indirim kararı ve ABD'den gelen güçlü perakende satış verileri, dolar endeksinde yukarı yönlü hareketi desteklemekte. Bu durum, DAX endeksinde de pozitif bir etki yaratıyor. Dünya genelinde özellikle Asya ve ABD piyasalarının karışık seyretmesi, DAXEUR üzerinde önemli bir baskı oluşturmuyor. Ancak, İngiltere ve ABD'den açıklanacak olan ekonomik verilerin yanı sıra Fed yetkililerinin açıklamaları, önümüzdeki süreçte DAXEUR üzerinde yön belirleyici olabilir. Teknik açıdan bakıldığında, DAXEUR şu an 19,555 seviyesinde bulunuyor ve önceki gün kapanışına göre %0,17'lik bir artış göstermekte. Grafik, 4 saatlik zaman dilimindedir. Ralli durumları, 19660 direnç seviyesinde yoğunlaşırken, daha fazla yükseliş durumunda 19755 ve 19850 seviyelerinin test edilmesi olası. Aksi yönde, 19545, 19465 ve 19350 destek seviyeleri izlenmelidir. RSI göstergesi 49.92 seviyesinde yer alarak nötr bir görünüme işaret ediyor. Bu, fiyatların dengeli bir şekilde hareket edebileceğini ve potansiyel olarak şu anki fiyat kanalında yatay bir seyir izleyebileceğini gösteriyor. Destek:19545 - 19465 - 19350- Direnç:19660 - 19755 - 19850-

NGCUSD

Daily Newsletter

U.S. natural gas futures are under pressure from weak demand due to power outages and the impact of hot weather following Hurricane Milton. The European Central Bank's interest rate cut and strong retail sales data announced in the U.S. also stirred market activity. While the Asian indices show mixed trends, the rising yields of U.S. 10-year bonds continue to support the dollar. Under these conditions, the selling pressure on the NGC/USD pair is supported by various factors. In the chart, the NGC/USD pair is monitored on an hourly timeframe. The levels of 2.33, 2.3, and 2.275 are notable support zones, while resistances are positioned at 2.355, 2.38, and 2.41. The RSI indicator stands at 43.99, displaying a negative outlook. In light of this data, a picture emerges where the downward trend continues, but recovery efforts should not be overlooked. Support:2.33 - 2.3 - 2.275 - Resistance:2.355 - 2.38 - 2.41 -

ABD doğal gaz vadeli işlemleri, Milton Kasırgası sonrası görülen elektrik kesintileri ve sıcak hava etkisiyle talep tarafındaki zayıflığın baskısı altında kalmış durumda. Avrupa Merkez Bankası'nın faiz indirimi ve ABD'de açıklanan güçlü perakende satış verileri de piyasalarda hareketlilik yarattı. Asya endekslerinde karışık seyir sürerken, ABD 10 yıllık tahvil getirilerinin yükselmesi doları desteklemeye devam ediyor. Bu koşullar altında, NGC/USD paritesinde satış baskısı farklı faktörler tarafından destekleniyor. Grafikte NGC/USD paritesi saatlik zaman diliminde izlenmekte. 2.33, 2.3 ve 2.275 seviyeleri önemli destek bölgeleri olarak dikkat çekerken, dirençler 2.355, 2.38 ve 2.41 seviyelerinde konumlanmış durumda. RSI göstergesi ise 43.99 seviyesinde olup negatif bir görünüm sergiliyor. Bu veriler ışığında, düşüş eğiliminin sürdüğü fakat toparlanma çabalarının da göz ardı edilmemesi gerektiği bir tablo ortaya çıkıyor. Destek:2.33 - 2.3 - 2.275 - Direnç:2.355 - 2.38 - 2.41 -