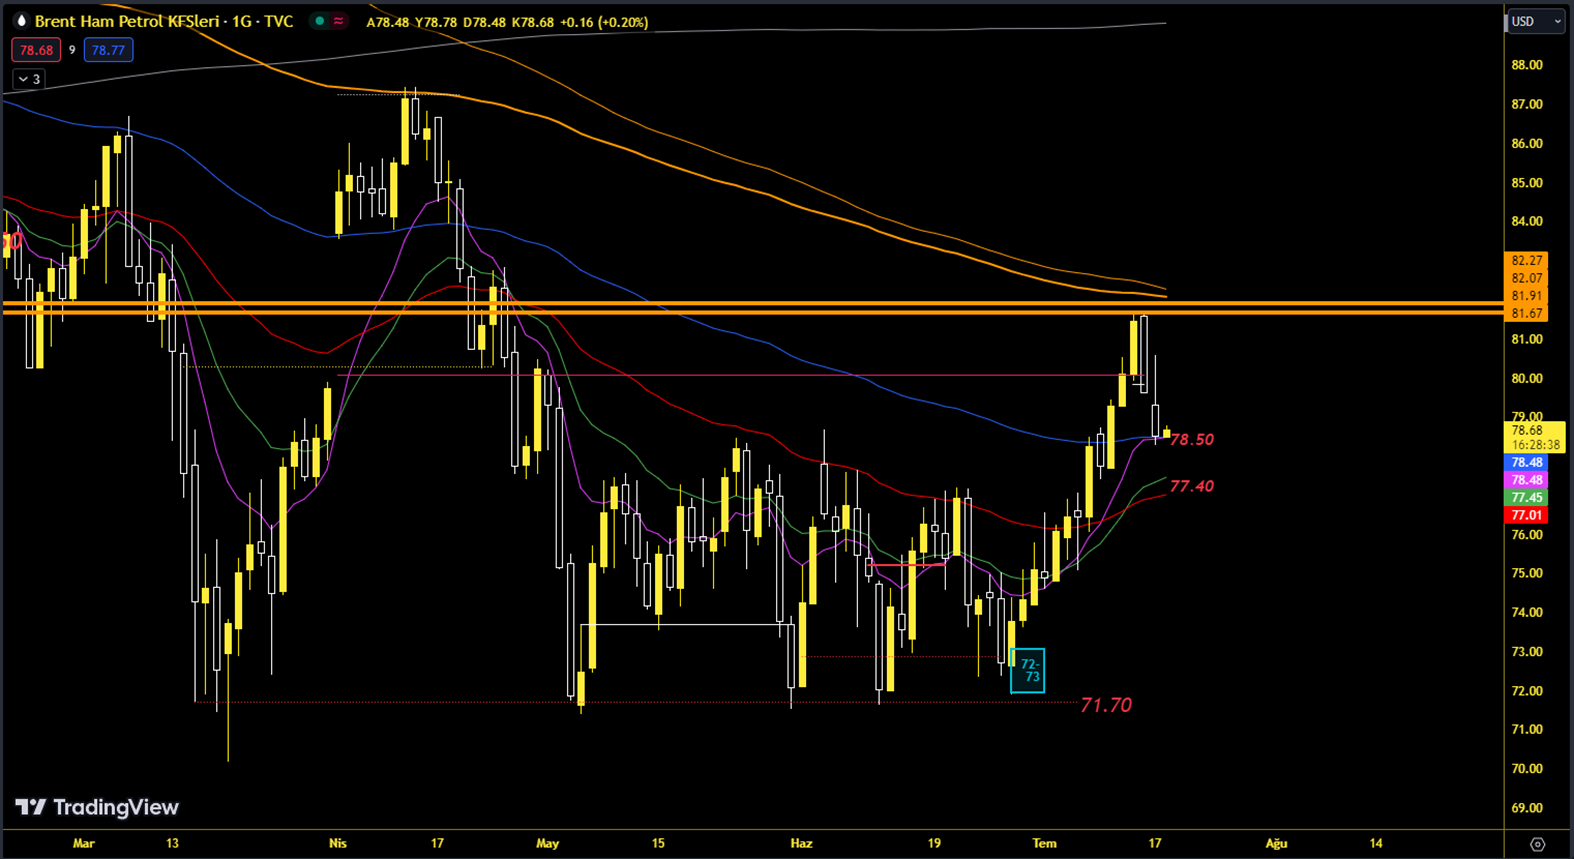
Brent
Brentin decline was triggered by the contact with the 200-day average resistance on the WTI side. They showed a correlated behavior and the deep decline was reflected on both sides. 78.50 and 77.40 bands are the levels that can be monitored for reaction. Support: 78.50 – 77.40 Resistance: 82.00