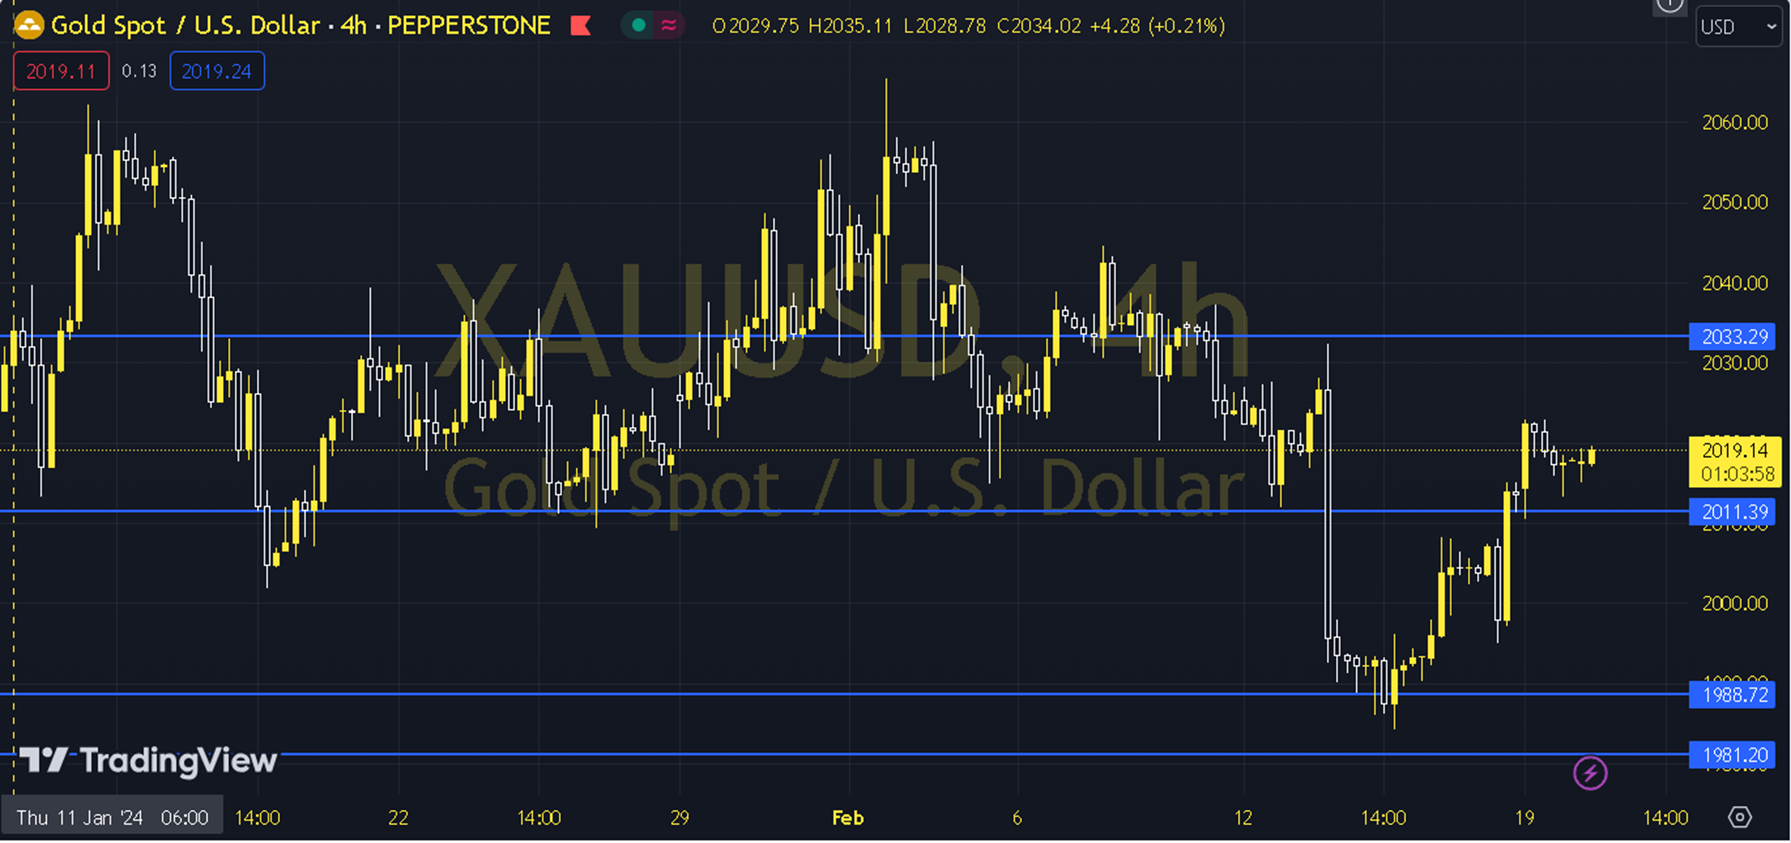
XAUUSD
Due to the limited movement of the US 10-year Treasury bond yield around 4.30%, ounce gold has recorded relatively horizontal movements in the short term. The precious metal, which opened the day at the 2017 level, is trading around the 2018 level while the analysis is being prepared. When we technically evaluate the short-term ounce gold pricing, we are following the 2003 - 2012 region, which is currently supported by the 34 (2012) period exponential moving average. As long as the precious metal is trading above the 2003 - 2012 region, the upward trend may continue. If the positive pricing demand continues, the 2021 and 2030 levels may be encountered. In the alternative view, it may be necessary to see permanence below the 2003 - 2012 region for the negative expectation to come to the fore. In this case, the 1993 and 1985 levels may come to the agenda. At this stage, the 1985 level may draw an outlook that limits the downward demand. Support: 2012-2003 Resistance: 2030-2042