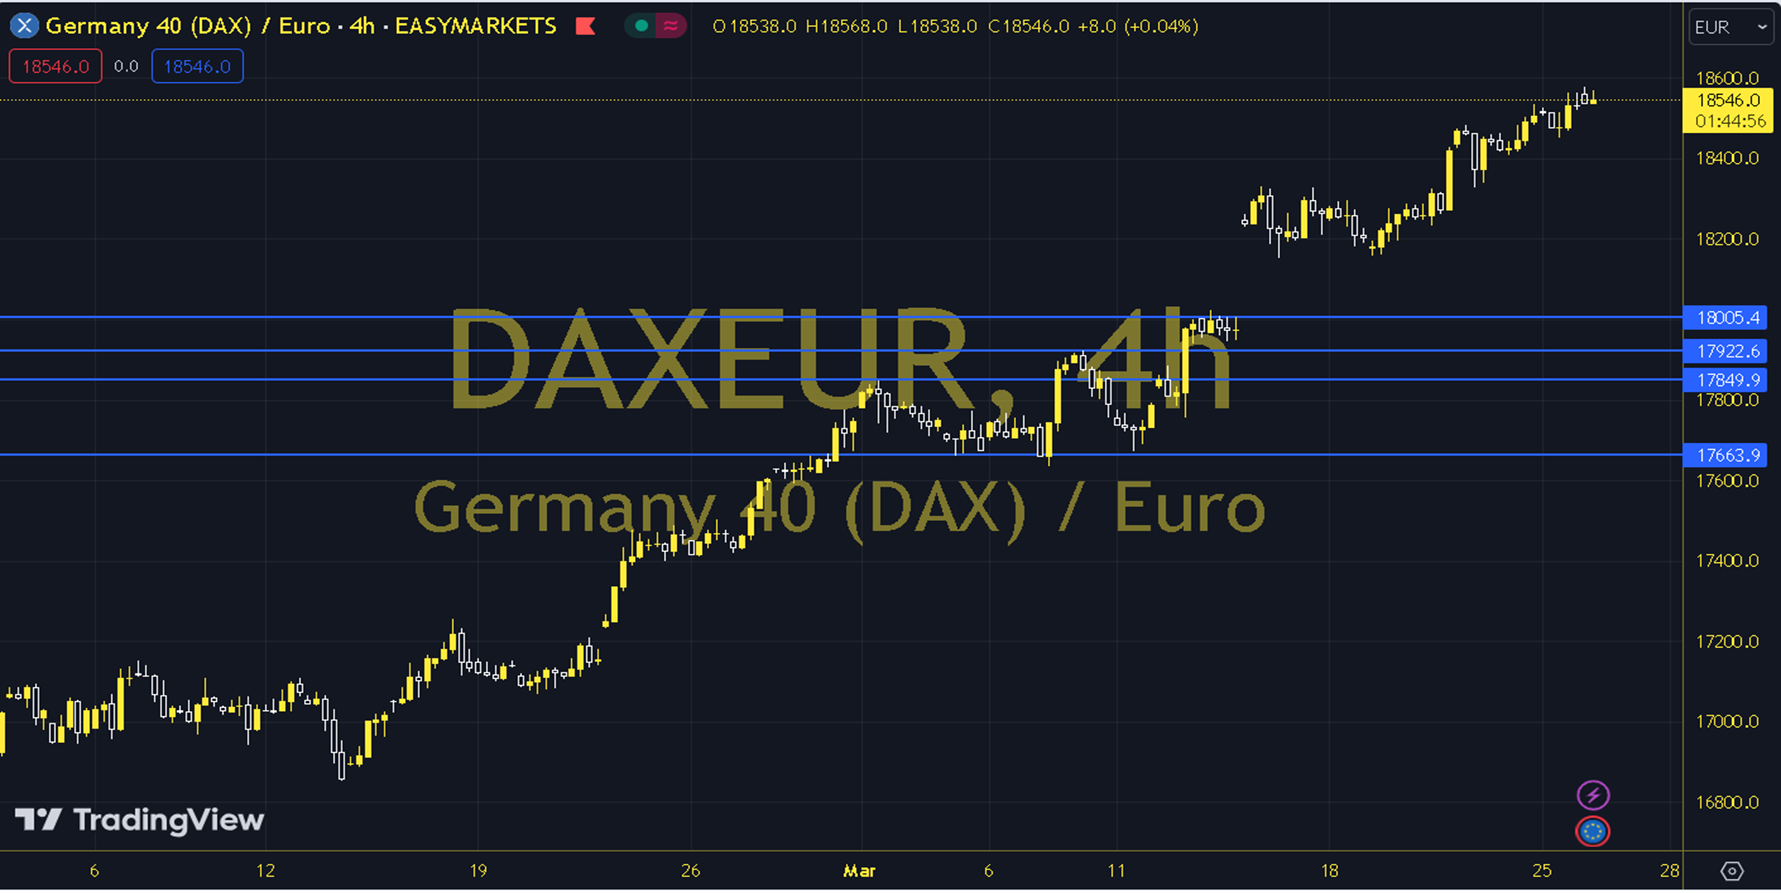
DAXEUR
In the week when there is no effective data flow for European markets, all eyes will be on the US PCE data for European stock markets. Since Friday is Good Friday, the European stock market will be closed, therefore, volatile movements can be observed in the indices due to the shallow market. When we examine the short-term chart of the DAXEUR index technically, we are following the 18100 - 18200 region with support from the 20-period exponential moving average. As long as the index receives support from the 20-period average at 18100, positive expectations are at the forefront. In increases, increases towards the 18400 level can be seen with the 18300 resistance exceeded. If the index cannot receive support from the 18200 level, negative expectations can come to the fore. In this case, downward deflections towards the 18000 level can be followed with support from the 89-period average. Support: 18100 - 18000 Resistance: 18300 - 18400