NDXUSD
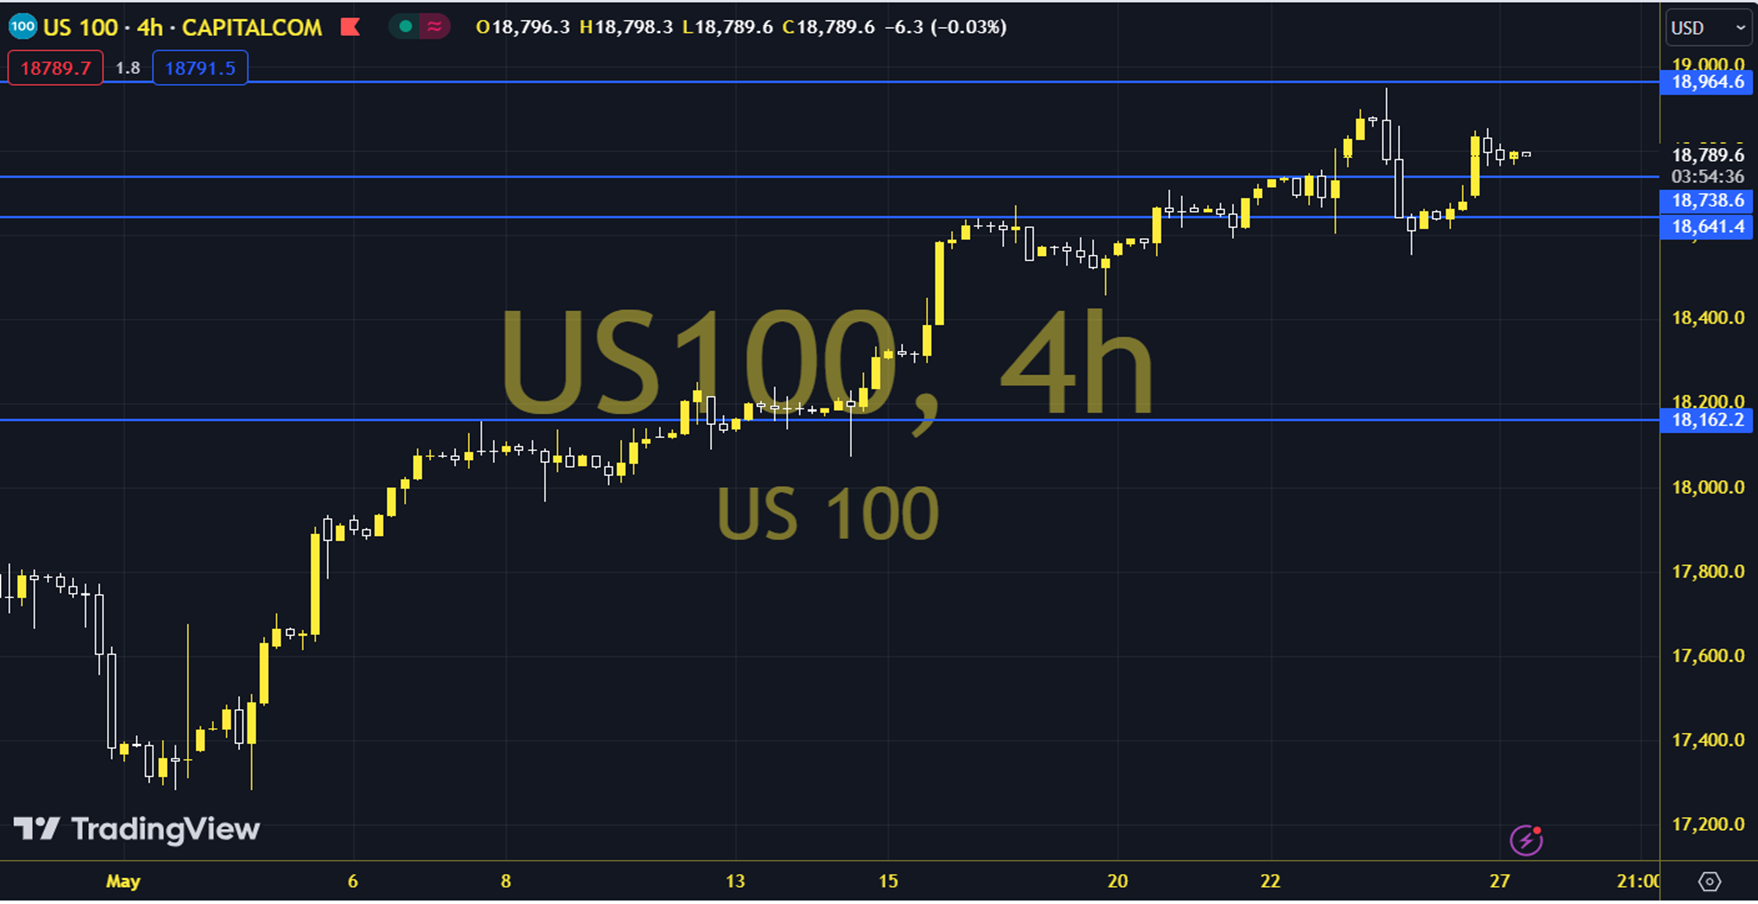
The Nasdaq index, which tested the intraday high of 1732 the day before, managed to complete the day with a 0.52% increase. Throughout the week, the PCE data, which the Fed follows as an inflation indicator, and the US growth data are among the most effective economic calendar data to be followed for index movements. When we technically examine the short-term pricing of the Nasdaq index futures contract, we are following the 18700 -18800 region for the index. The pricing of the index outside the region will be monitored. It may be necessary to see movement above the 18900 resistance for positive expectations. In increases, the 19000 - 19100 levels can be followed as resistance. In decreases, if it falls below 18700, a pullback to 18600 can be seen. Support: 18700 - 18600 Resistance: 18900 - 19000