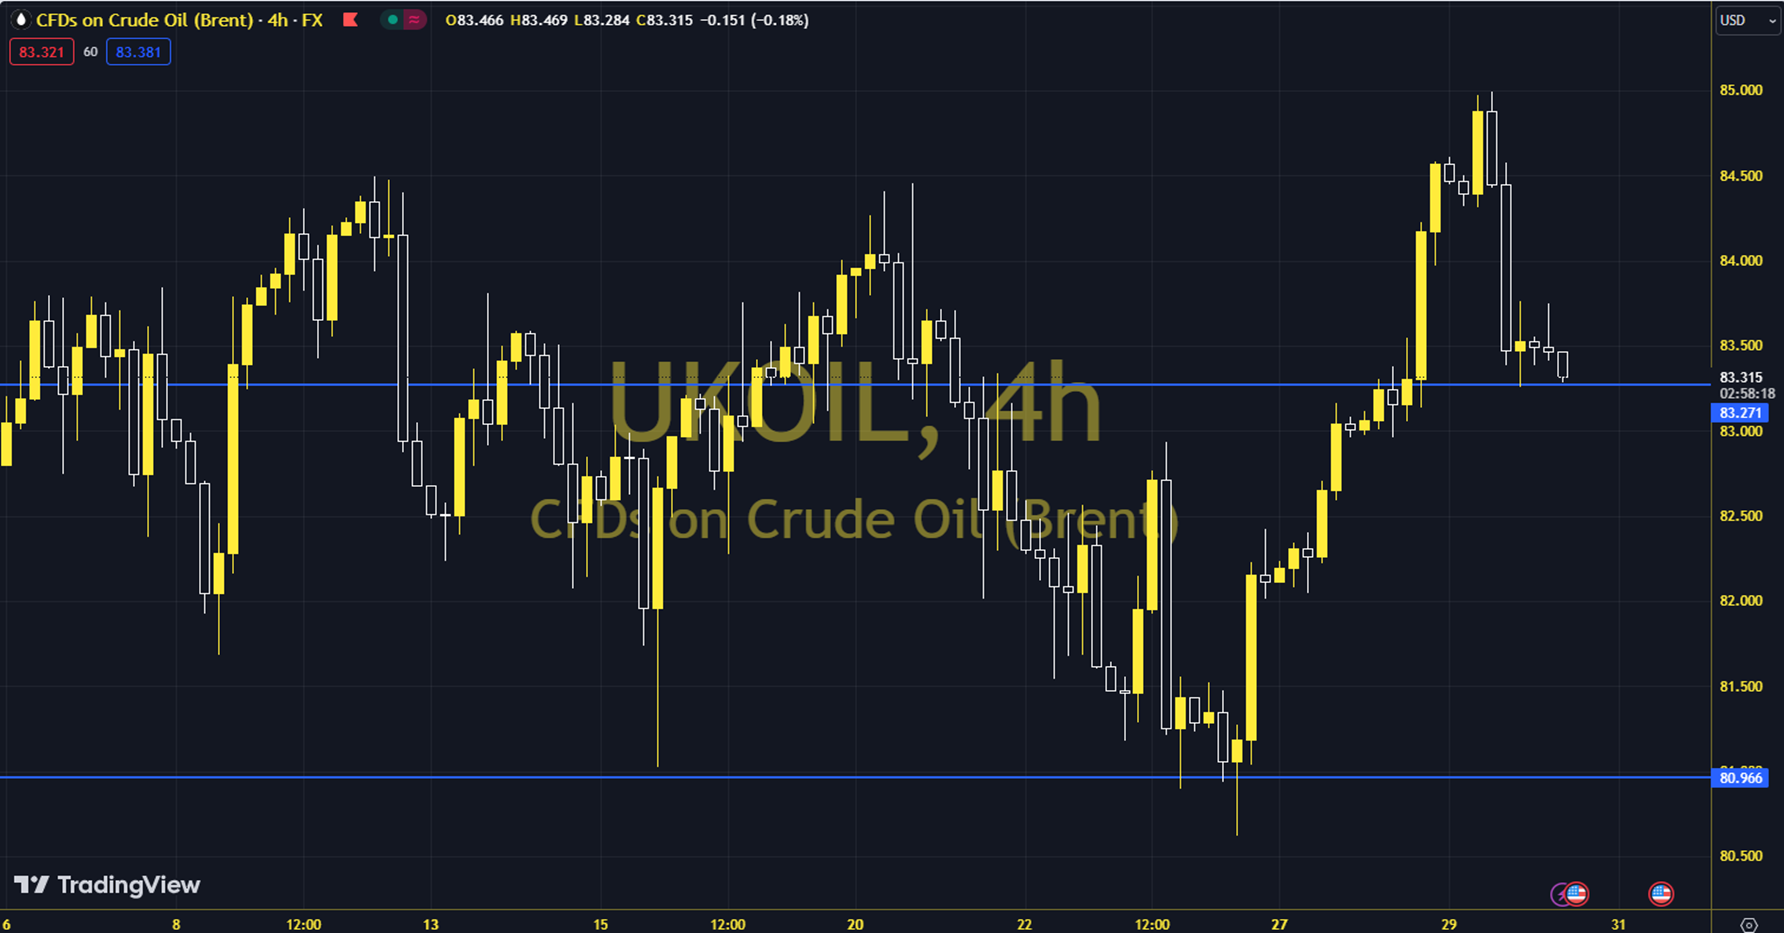
BRENT
Oil futures rose with the theme of geopolitical risk, then were pulled back to the average area by being exposed to profit taking. The American Petroleum Institute's announcement of a decrease of over 6 million barrels in stocks seems to have only been effective in balancing this picture. The course of European and US stock exchanges and the stock figures to be announced by the US Energy Information Administration can be followed during the day. It is seen that there is a general downward trend. Brent oil saw a high of 84.69 and a low of 83.13 on the previous trading day. Brent oil, which followed a selling trend on the last trading day, lost 1.11% daily. The RSI indicator for the commodity, which is below its 20-day moving average, is at 47.88, while its momentum is at 100.18. The 83.73 level can be followed in intraday upward movements. If this level is exceeded, the resistances of 84.33, 85.29 and 85.89 may become important. In case of possible pullbacks, 82.77, 82.17 and 81.21 will be monitored as support levels. Support: 82.77 – 82.17 Resistance: 83.73 – 84.33