BRENT
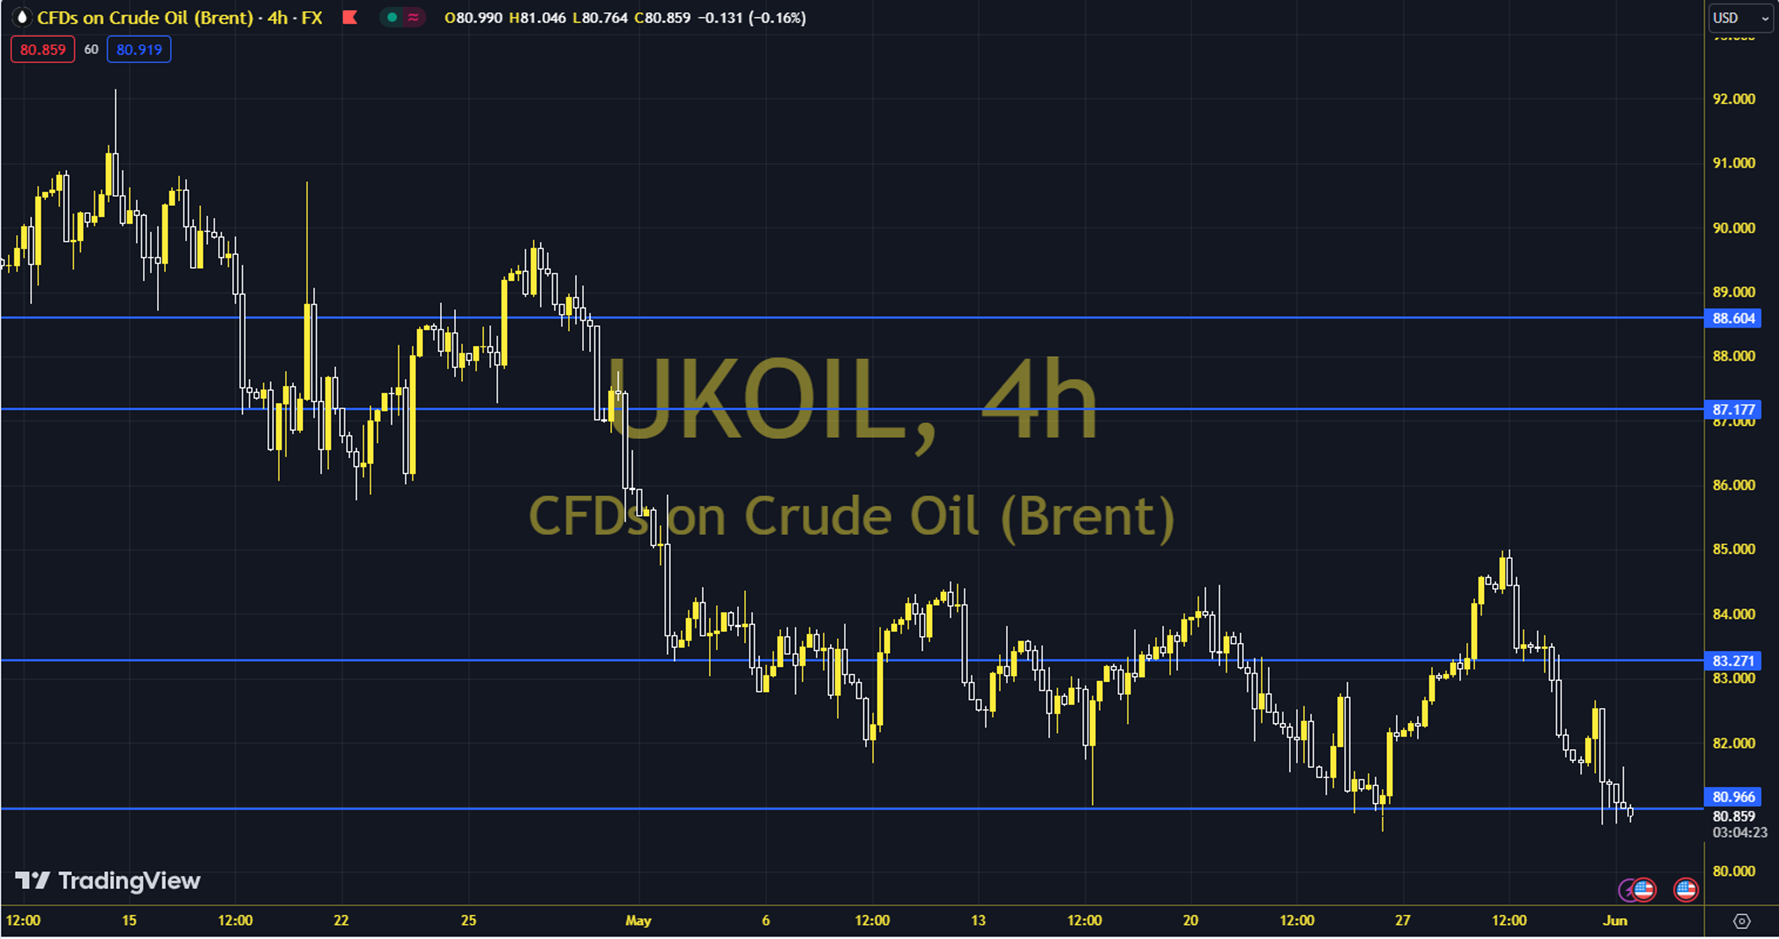
Oil futures followed a course that tried to balance after the American Petroleum Institute announced an increase of over 4 million barrels in stocks. We had watched losses come to the fore in the previous two days. The course of European and US stock exchanges and the stock figures to be announced by the US Energy Information Administration can be followed during the day. It is seen that there is a general downward trend. Brent oil saw a high of 78.17 and a low of 76.74 on the previous trading day. Brent oil, which followed a selling course on the last trading day, lost 1.25% daily. The RSI indicator for the commodity, which is below its 20-day moving average, is at 28.09, while its momentum is at 92.16. The 77.96 level can be followed in intraday upward movements. If this level is exceeded, the 78.78 and 79.39 resistances may become important. In possible pullbacks, 76.53, 75.92 and 75.10 will be followed as support levels. Support: 76.53 – 75.92 Resistance: 77.96 – 78.78