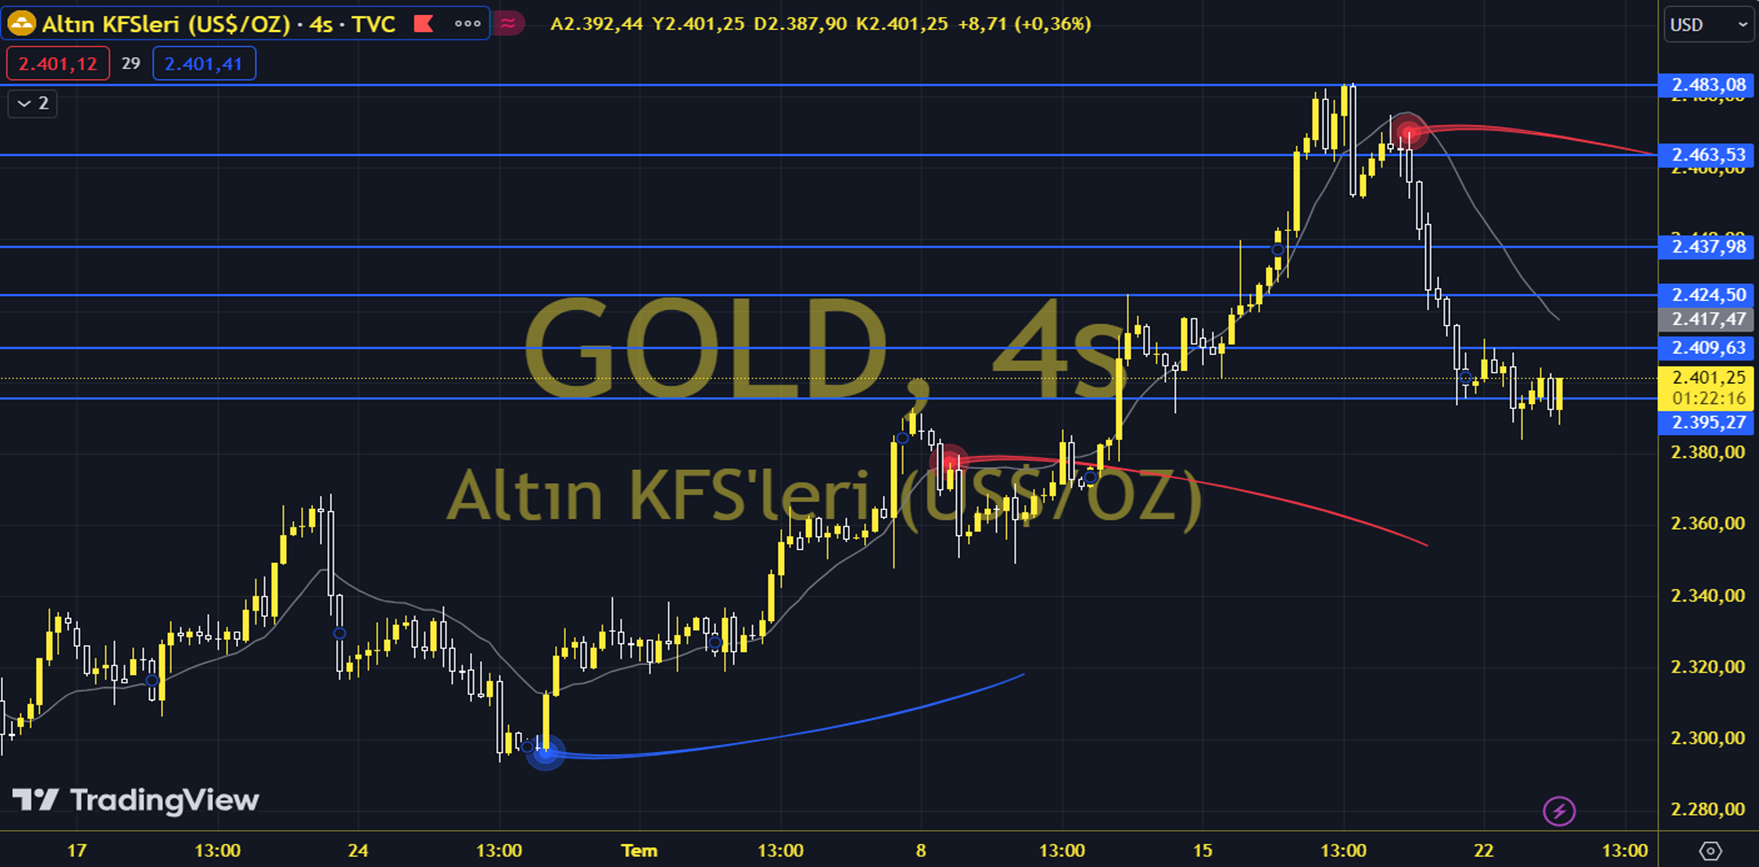
XAUUSD
The ounce of gold remained under pressure ahead of both the rise in the US 10-year Treasury yield and the effective US data. With the pullback, the ounce of gold fell to its lowest levels in the last 2 weeks. For precious metal pricing, the leading growth rate and its deflator, unemployment benefit applications and durable goods orders can be monitored during the day. As long as it remains below the 2,381.40 level, we can see downward relaxation. The daily loss for the ounce of gold, which closed at 2,376.02 on the previous trading day, was 0.89%. The upward movement observed in US bond yields is pressuring the ounce of gold downward. The RSI indicator for the ounce of gold, which is below its 20-day moving average, is at 48.52, while its momentum is at 100.52. The 2381 level can be followed in intraday upward movements. If this level is exceeded, the 2,395 and 2,415.80 resistances may become important. In case of possible pullbacks, 2,361 and 2,347 will be monitored as support levels. Support: 2361 - 2347 Resistance: 2395 - 2415