USDJPY
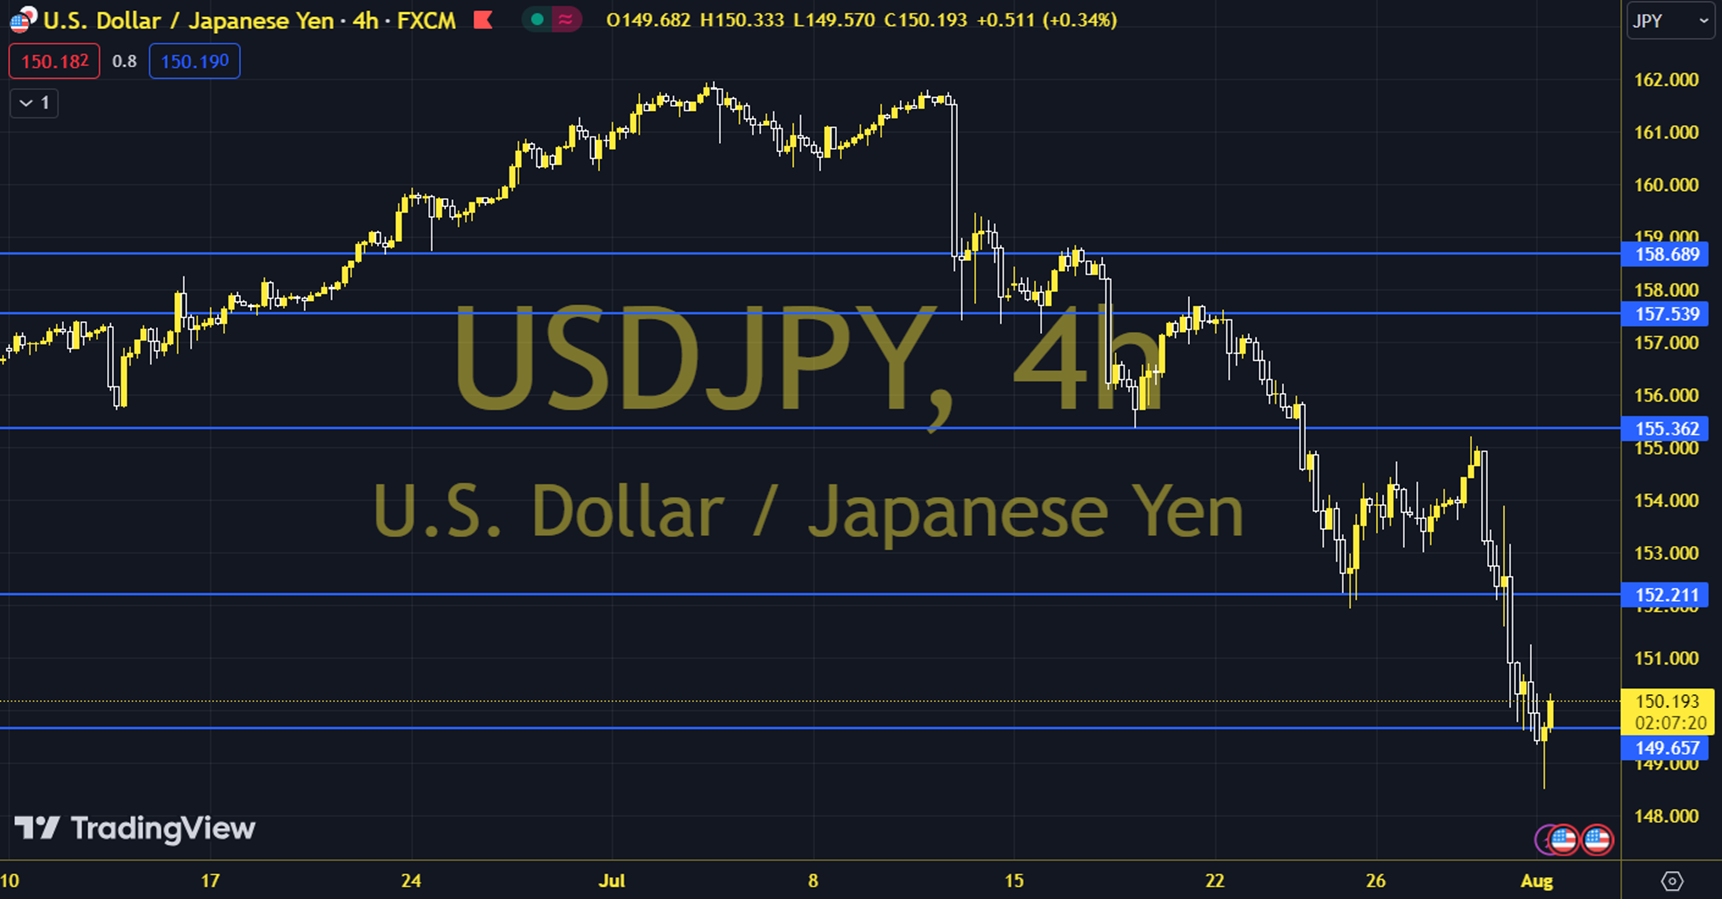
USD/JPY is falling rapidly from its early July highs. After peaking at 161.95 on July 3, the breakout of the main trendline at 158.45 on July 13 was a game-changer for the pair, and when considered together with the more recent break below the July low of 149.15, it has given the chart a much more bearish outlook. The downward movement observed in the dollar index is pressuring the pair to the downside. The pair, which closed at 143.14 on the previous trading day, has a daily loss of 2.02%. The pair, which is below its 20-day moving average, has an RSI of 11.86, while its momentum is at 90.96. Intraday upside movements can be followed at 143.97. If this level is passed, resistance levels of 145.72, 148.29 and 150.04 may become important. In case of possible pullbacks, support levels of 141.39, 139.65 and 137.07 will be monitored. Support: 141.390 – 139,650 Resistance: 143.970 – 145.720