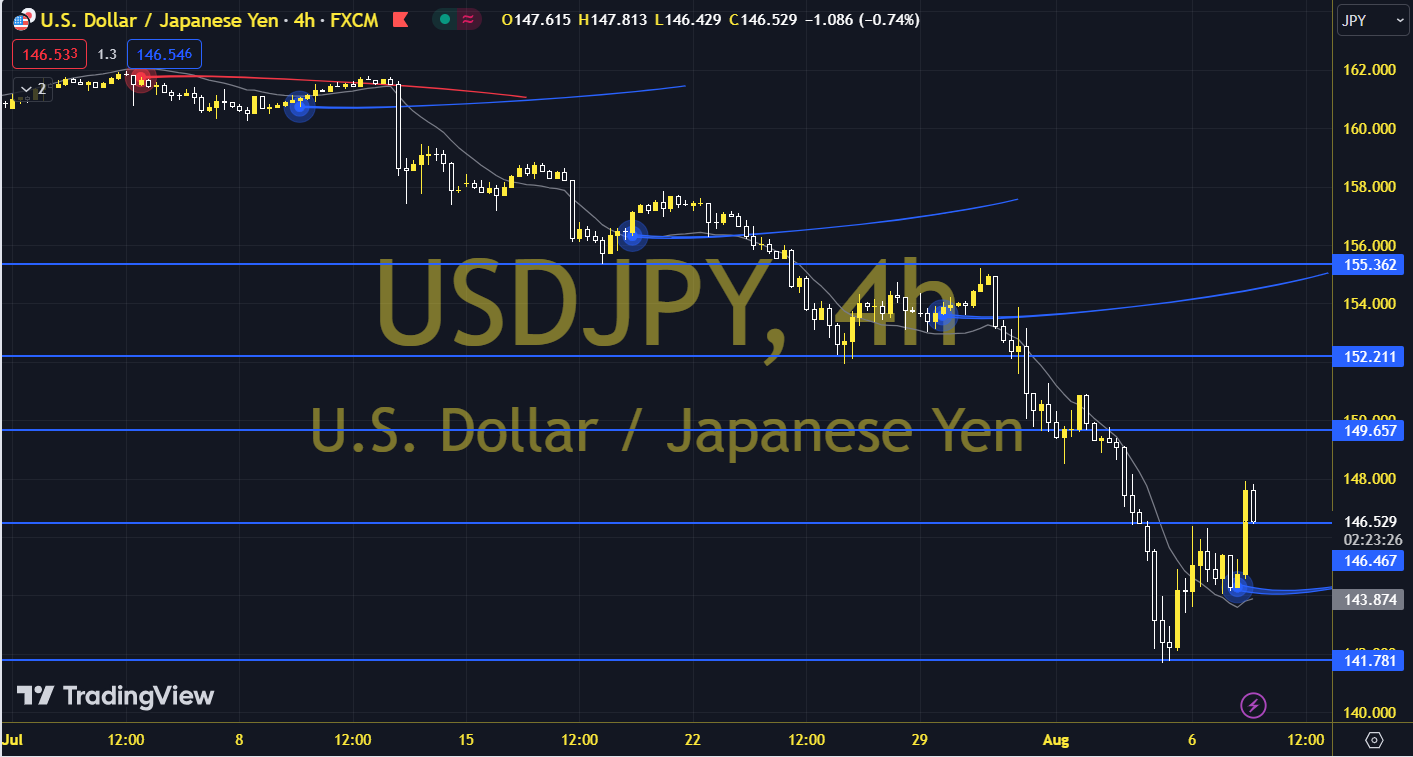
USDJPY
USD/JPY is falling rapidly from its early July highs. After peaking at 161.95 on July 3, the breakout of the main trendline at 158.45 on July 13 was a game-changer for the pair, and when considered together with the more recent break below the July low of 149.15, it gave the chart a much more bearish outlook. The pair closed at 147.66 on the previous trading day, resulting in a 2.31% daily gain. The pair, which is below its 20-day moving average, has momentum at 94.03, while the RSI indicator is at 31.36. The intraday downtrend could be monitored at 146.63. If it falls below this level, supports at 145.35, 143.04 and 141.76 could become important. In case of possible increases, resistance levels at 148.94, 150.22 and 152.53 could be monitored. Support: 146.630 – 145.350 Resistance: 148.940 – 150.220