XAUUSD
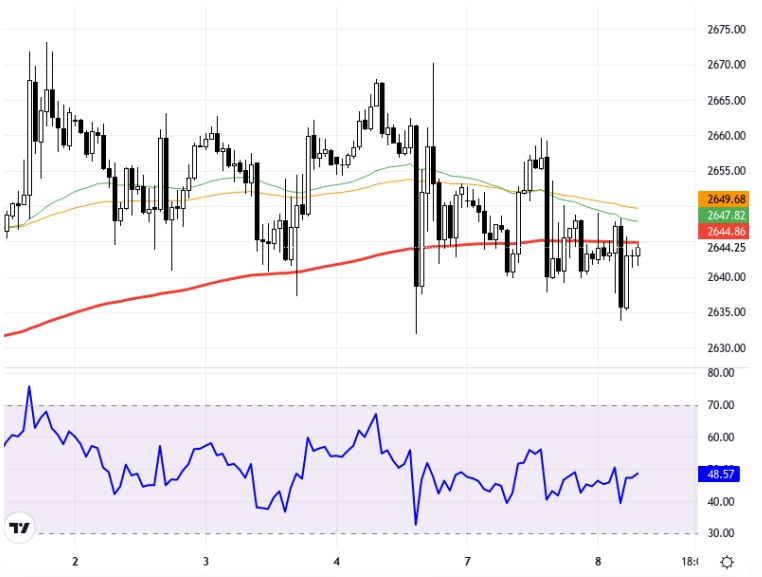
In recent times, gold finds support due to heightened geopolitical risk perception and strong safe haven demand. Although there is limited pressure on gold following the rise in the dollar index, factors such as IsraelIran tensions help the precious metal recover. Additionally, data from the U.S. regarding hourly earnings, unemployment rate, and non-farm payroll changes during the day could influence the metal's direction. In light of these uncertainties, gold investors are monitoring whether prices can hold in the 2640 - 2650 range; staying above this level could lead to a positive trend, while dropping below it might bring declines back into focus. From a technical perspective, the chart is in a 1-hour time frame. Gold is currently trading at the 2666 level. Support areas are being monitored at 2640 and 2630, while upward resistance levels are set at 2670 and 2680. The RSI indicator is at 66.66, showing a positive outlook. Today, it experienced a 0.11% loss compared to the previous close. These data indicate that gold is technically under upward pressure and may have the potential to surpass the 2670 level in the short term. Support:2640 - 2630 - 2620 - Resistance:2660 - 2670 - 2680 -
Ons altın, son dönemde jeopolitik risk algısının artması ve güvenli liman talebinin yüksek seyretmesi ile destek buluyor. Dolar endeksinde görülen yükselişin ardından ons altın üzerinde sınırlı bir baskı oluşsa da, İsrail-İran gerilimi gibi etmenler kıymetli metalin toparlanmasını sağlıyor. Ayrıca, gün içerisinde ABD’den gelecek saatlik kazançlar, işsizlik oranı ve tarım dışı istihdam değişimi verileri metalin yönü üzerinde etkili olabilir. Bu belirsizlikler ışığında, altın yatırımcıları fiyatların 2640 - 2650 bölgesinde tutunup tutunamayacağını takip ediyor; bu seviyenin üzerinde kalınması pozitif eğilim doğurabilirken, altına inilirse düşüşler yeniden gündeme gelebilir. Teknik açıdan incelendiğinde, grafik 1 saatlik zaman dilimindedir. Altın şu anda 2666 seviyesinden işlem görüyor. Destek bölgeleri 2640 ve 2630 olarak izleniyor, yukarı yönlü direniç seviyeleri ise 2670 ve 2680 olarak belirlenmiş. RSI göstergesi 66.66 seviyesinde ve pozitif bir görünüm sergiliyor. Bugün önceki kapanışına göre %0.11 oranında bir değer kaybı yaşadı. Bu veriler, altının teknik olarak yukarı yönlü baskı altında olduğunu ve kısa vadede 2670 seviyesi üzerine çıkma potansiyeline sahip olabileceğini gösteriyor. Destek:2640 - 2630 - 2620 - Direnç:2660 - 2670 - 2680 -