EURUSD
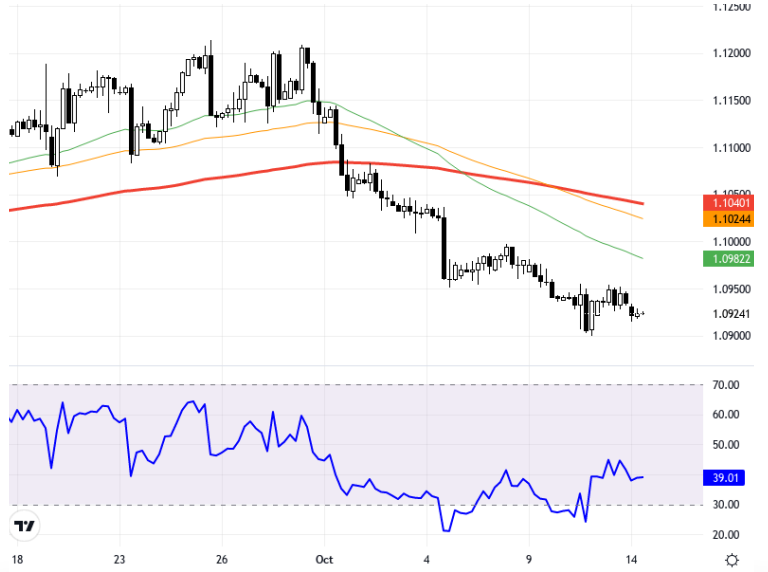
For the EUR/USD pair, this week the markets' focal point will be the European Central Bank's (ECB) interest rate decision and President Lagarde's statements. Consumer Price Index data from the UK, retail sales in the US, and statements from Fed officials are also being closely monitored. Clues related to the expected 25 basis point rate cuts from the ECB and Fed in upcoming meetings could impact the pair. Additionally, movements in the dollar index can shape the trend of the EUR/USD pair. In this context, the dollar index's ability to stay above its 233-day moving average could support the dollar against the euro. From a technical standpoint, the EUR/USD pair is moving below the 144 and 233-period moving averages located at the 1.1040 level on the 4-hour chart. This indicates that the pair is under downward pressure. Support levels can be monitored at 1.0905, 1.0870, and 1.0830. In upward movements, these averages could form resistance. The RSI indicator is at 39, displaying a negative trend. The pair is exhibiting a flat trend compared to the previous day. The current price is trading at the 1.0923 level. Support:1.09 - 1.087 - 1.083 - Resistance:1.094 - 1.099 - 1.104 -
EUR/USD paritesi için bu hafta piyasaların odak noktası Avrupa Merkez Bankası'nın (ECB) faiz kararı ve Başkan Lagarde’ın açıklamaları olacak. İngiltere'den gelecek TÜFE verileri, ABD'deki perakende satışlar ve Fed yetkililerinden gelecek açıklamalar da dikkatle izleniyor. ECB ve Fed’in önümüzdeki toplantılarda beklenen 25 baz puanlık faiz indirimlerine ilişkin ipuçları, parite üzerinde etkili olabilir. Ayrıca, dolar endeksinin hareketleri de EUR/USD paritesinin seyrini şekillendirebilir. Bu kapsamda, dolar endeksinin 233 günlük hareketli ortalaması üzerinde kalmayı başarması, euro karşısında dolara destek verebilir. Teknik açıdan, EUR/USD paritesi 4 saatlik grafikte 1,1040 seviyesinde bulunun 144 ve 233 periyotluk hareketli ortalamaların altında hareket etmekte. Bu durum, paritenin aşağı yönlü baskı altında olduğunu gösteriyor. Aşağıda 1,0905, 1,0870 ve 1,0830 seviyeleri destek olarak izlenebilir. Yukarı yönlü hareketlerde ise bu ortalamalar direnç oluşturabilir. RSI göstergesi 39 seviyesinde, negatif bir eğilim sergiliyor. Paritede bir önceki güne göre yatay bir seyir gözlenmekte. Güncel fiyat 1,0923 seviyesinde seyrediyor. Destek:1.09 - 1.087 - 1.083 - Direnç:1.094 - 1.099 - 1.104 -