BRNUSD
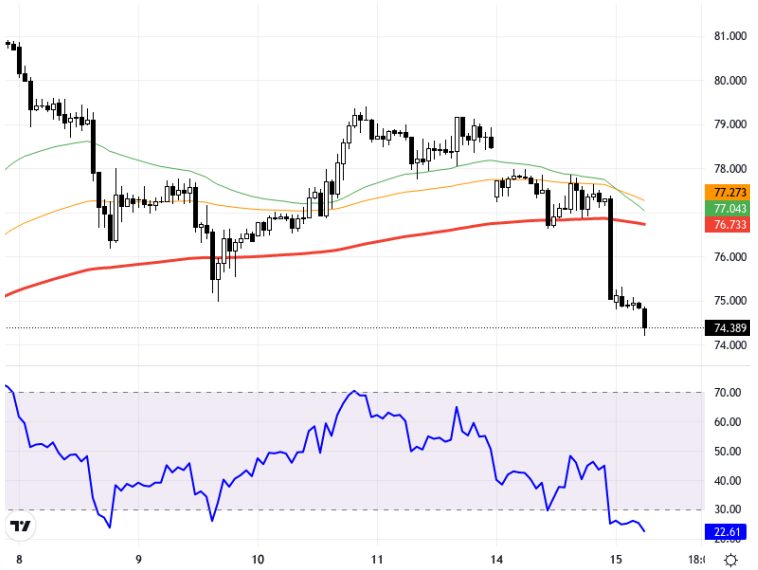
The oil market starts the week with a complex beginning, fueled by geopolitical and economic news such as Israel's potential military moves against Iran and China's economic stimulus announcements. China's promise to support the real estate sector, without specifying the amount, caused fluctuations in Asian indices. In Europe, the ECB's interest rate decision and the possibility of a rate cut by the Fed in the US are closely watched by the markets. This situation causes oil prices to exhibit a downward trend as long as they remain below the resistance levels of $78.00-$78.50. However, the possible risks and uncertainties could exert pressure on oil prices, leading to a volatile path. In the hourly chart of the BRNUSD pair, while the support levels of 77.50 and 77.00 are monitored, upward movements might encounter resistance at levels of 78.50 and subsequently at 79.00. The RSI indicator, at level 22.61, presents a negative outlook, indicating that prices might fall further. Compared to the previous day, there is a decrease of 0.11%. The current price is trading at 74.38. As long as there are no hourly closings above 78.50, the downward expectations may gain weight. Support:74.5 - 74 - 73.5 - Resistance:75.5 - 76 - 76.5
Petrol piyasası, haftaya İsrail'in İran'a yönelik potansiyel askeri hamleleri ve Çin'in ekonomik teşvik açıklamaları gibi jeopolitik ve ekonomik haberlerle karmaşık bir başlangıç yapıyor. Çin’in, gayrimenkul sektörünü destekleme vaadi verip miktar belirtmemesi, Asya endekslerinde dalgalanmalara neden oldu. Avrupa'da ECB'nin faiz kararı ve ABD'de Fed'in faiz indirim olasılığı piyasalar tarafından izleniyor. Bu durum, petrol fiyatlarının 78,00-78,50 dolar direnç seviyeleri altında kaldıkça aşağı yönlü bir eğilim sergilemesine neden oluyor. Ancak olası risk ve belirsizliklerin petrol fiyatları üzerinde baskı yaratması, fiyatların değişken bir seyir izlemesine yol açabilir. BRNUSD paritesinin saatlik grafiğinde, 77,50 ve 77,00 destek seviyeleri izlenirken, yukarı yönlü hareketler 78,50 ve daha sonrasında 79,00 direnç seviyelerine takılabilir. RSI göstergesi 22.61 seviyesinde, negatif bir görünüm sergileyerek fiyatların daha da düşebileceğine işaret ediyor. Bir önceki gün ile kıyaslandığında %0.11 oranında bir düşüş görülüyor. Güncel fiyat ise 74.38 seviyesinde işlem görüyor. Fiyat hareketleri 78,50'un üzerinde saatlik kapanışlar yapmadıkça, aşağı yönlü beklentiler ağırlık kazanabilir. Destek:74.5 - 74 - 73.5 - Direnç:75.5 - 76 - 76.5