Nasdaq100 USTEC
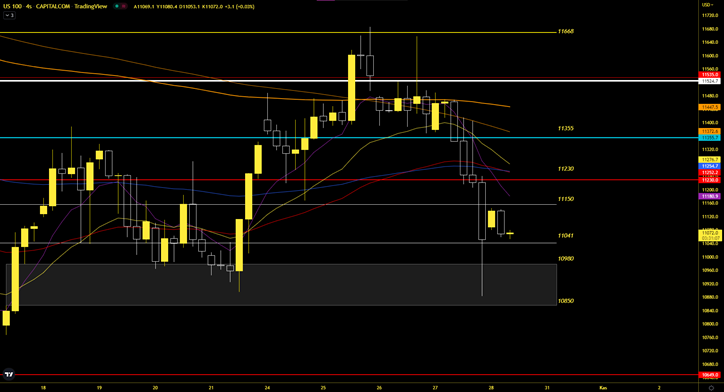
Nasdaq experienced a strong sell-off from the EMA50 resistance on the daily charts. The index failed to close above the resistance. The price was pulled directly into the imbalance zone formed at the previous bottom. The market structure was disrupted again. Support: 11041 – 10980 - 10850 Resistance: 11150 – 11230 - 11355


