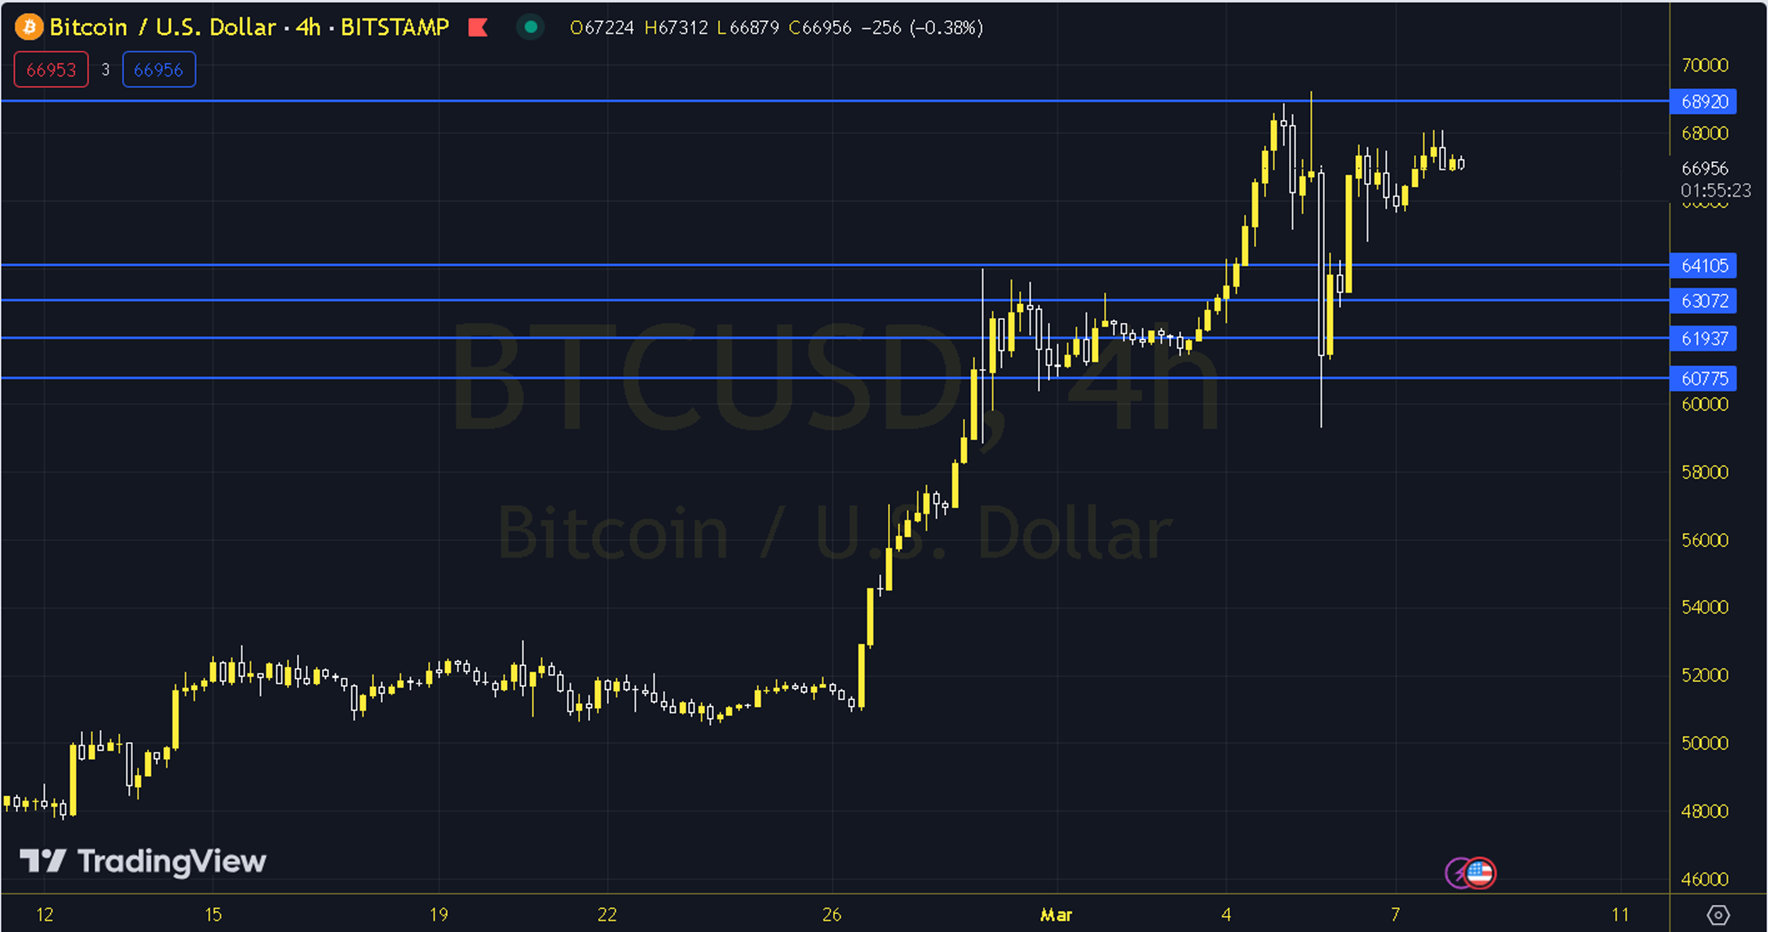
BTCUSD
After days of activity for Bitcoin, it was a relatively more horizontal day. The horizontal movement we call is a daily increase of 2%. Since there has been a lot of volatility lately, even this movement looks horizontal to us. Today on the Economic Calendar, the TDI Data, which is perhaps the most important data of the month, will come. There will be a lot of volatility. Be careful, we can suddenly pass 69000 and see it at 72000, or we can drop to 63000 and see 59000. Our expectation is still in the Medium Term (3 Months), to benefit from the dual benefits of the BTC halving and monetary policy changes. Technically, if Bitcoin, which broke its 7-day average around 61000, breaks the 68000 resistance again on a daily basis, we can see a 69000 movement. If sales increase, the 64500 support is the strongest support. Support: 64500 - 63100 Resistance: 68000 - 69000