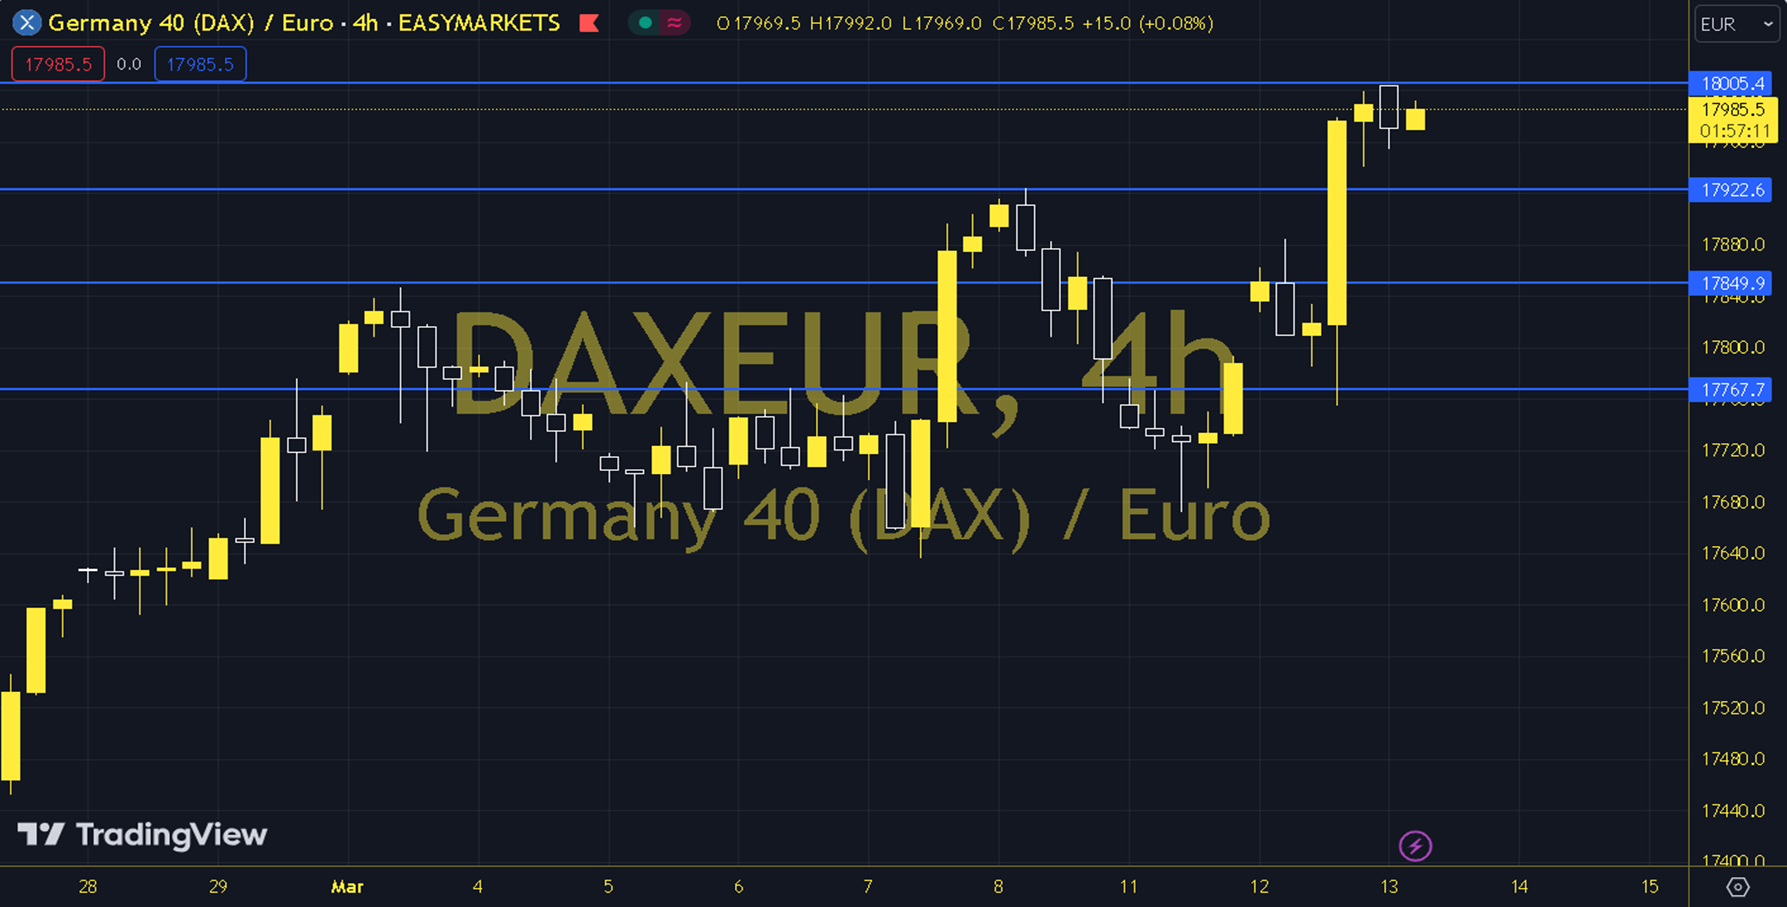
DAXEUR
The US February inflation announced the day before increased risk appetite in US stock markets, while the European side was also positively affected by the data. When we technically examine the short-term chart of the DAXEUR index, we are following the 18000 - 18100 region with support from the 20-period exponential moving average. As long as the index moves above the relevant region, positive expectations are at the forefront. In increases, increases towards 18300 and then 18400 can be seen. In the alternative scenario, in case of possible suppression around the 18300 resistance, it is expected that the declines will accelerate with the index falling below the 18000 level for negative expectations. In this case, declines towards 17700 can be followed with support from the 89-period average. Support: 17900 - 17800 Resistance: 18000 - 18100