BRENT
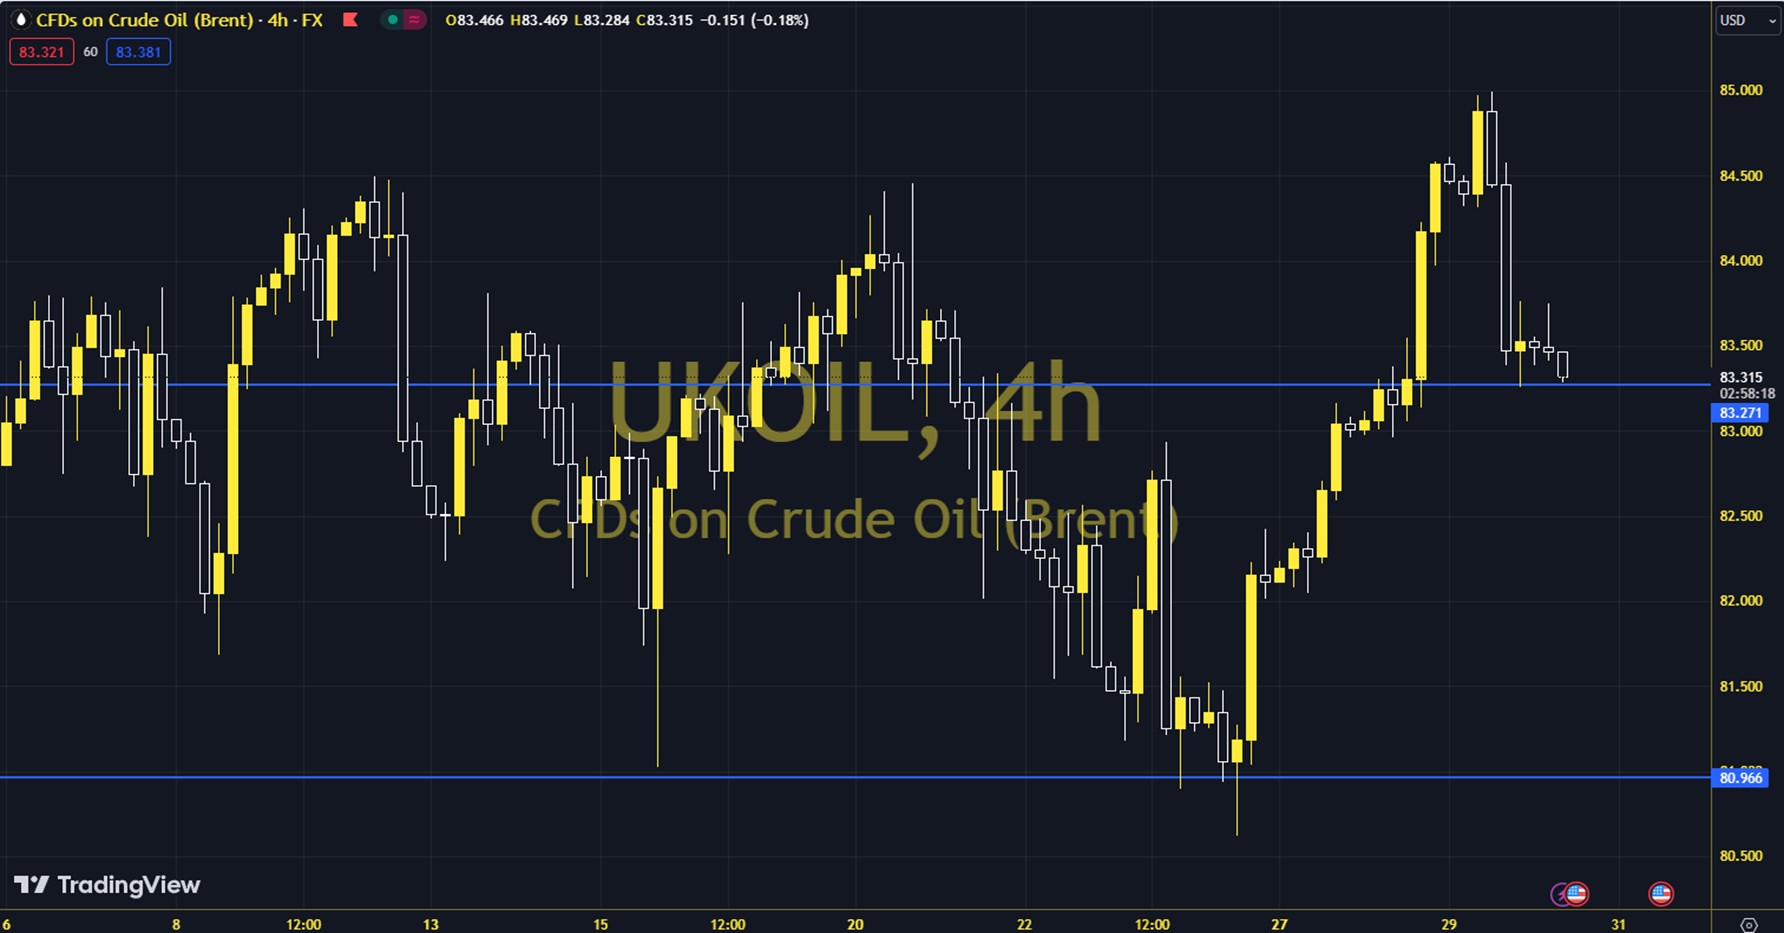
Oil prices, which rose in the first half of the week under the leadership of geopolitical risk perception, were subject to sales that headed towards weekly losses in the second half. High supply - weak demand concerns were effective in this. The course of European and US stock markets and US PCE inflation data can be followed during the day. In general, a downward trend is seen. Brent oil saw a highest level of 83.53 and a lowest level of 81.81 on the previous trading day. Brent oil, which followed a selling course on the last trading day, lost 1.78% daily. The RSI indicator for the commodity, which is below its 20-day moving average, is at 41.67, while its momentum is at 99.27. The 82.41 level can be followed in intraday upward movements. If this level is exceeded, the resistances of 83.01, 84.13 and 84.73 may become important. In possible pullbacks, 81.28, 80.69 and 79.56 will be monitored as support levels. Support: 81.28 – 80.69 Resistance: 82.41 – 83.01