NDXUSD
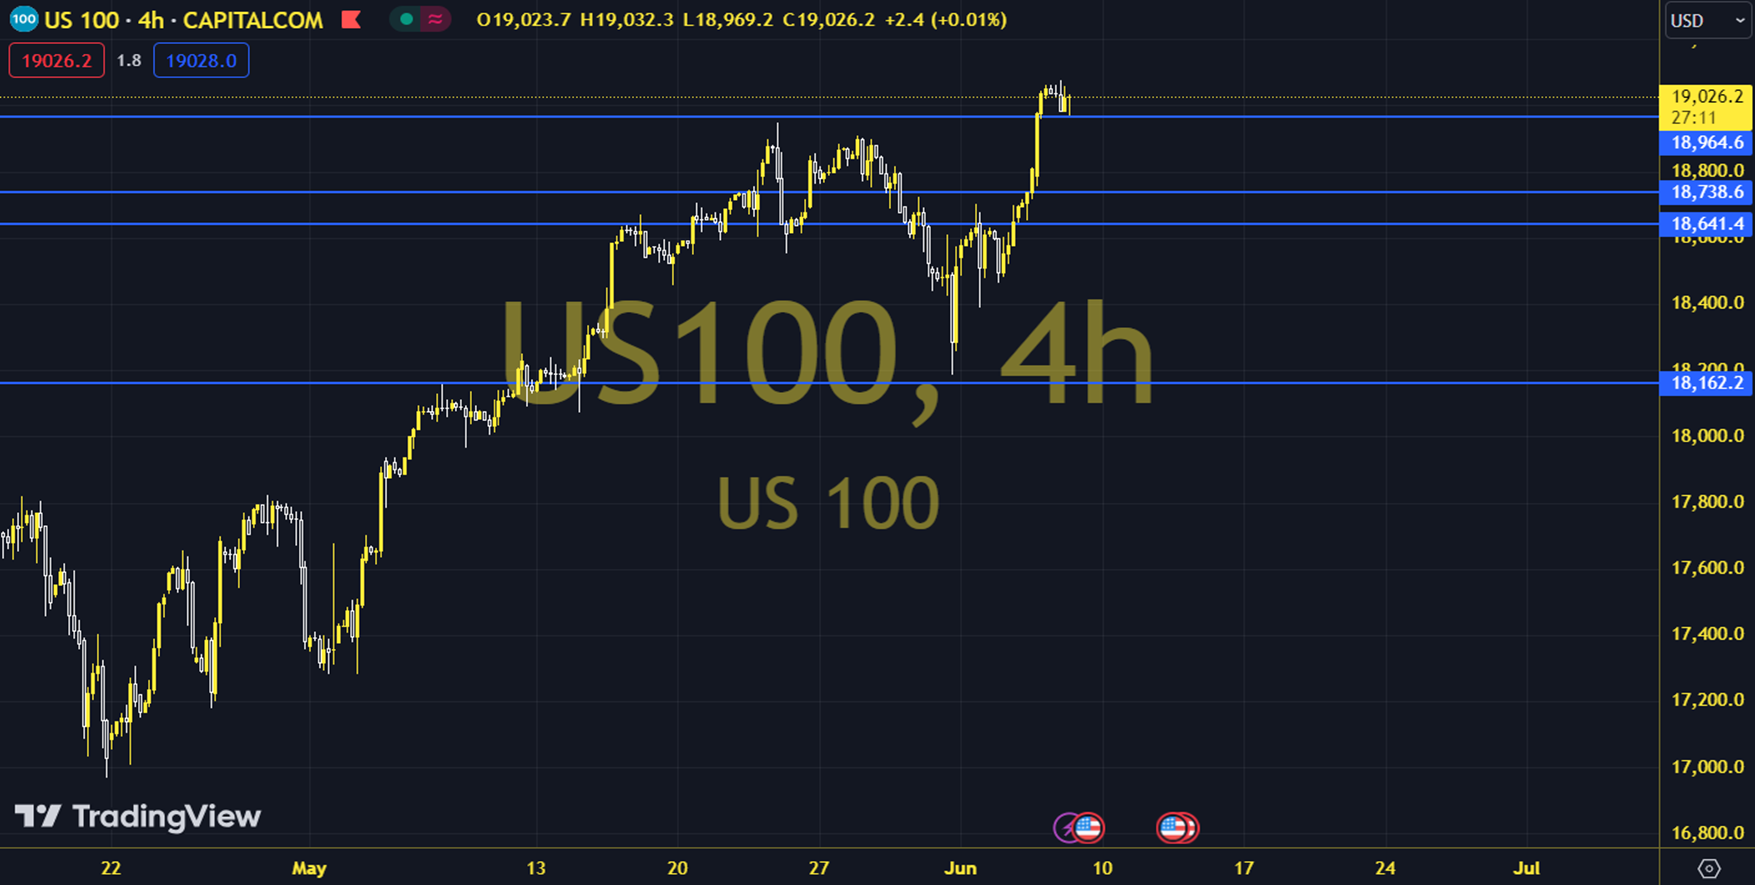
In the middle of the week, the NASDAQ100 index reached new highs as the US 10-year bond yield fell to 4.40%. For the index, which started the day at 19239 and was priced around 19257 while the analysis was being prepared; CPI data and the Fed's monetary policy statement can be followed during the day. The NASDAQ100 index continues to move above the region supported by the indicators we follow. When we technically evaluate the short-term pricing of the index, as long as the 21 (19089) period exponential moving average currently supports the 19025 - 19100 region, the positive trend may continue. If the upward demand continues, a movement area may form towards the 19300 and 19400 levels. In the alternative view, permanent pricing below the 19025 - 19100 region may be needed for the downward trend to become dominant. Support: 19100 – 19025 Resistance: 19300 – 19400