USDJPY
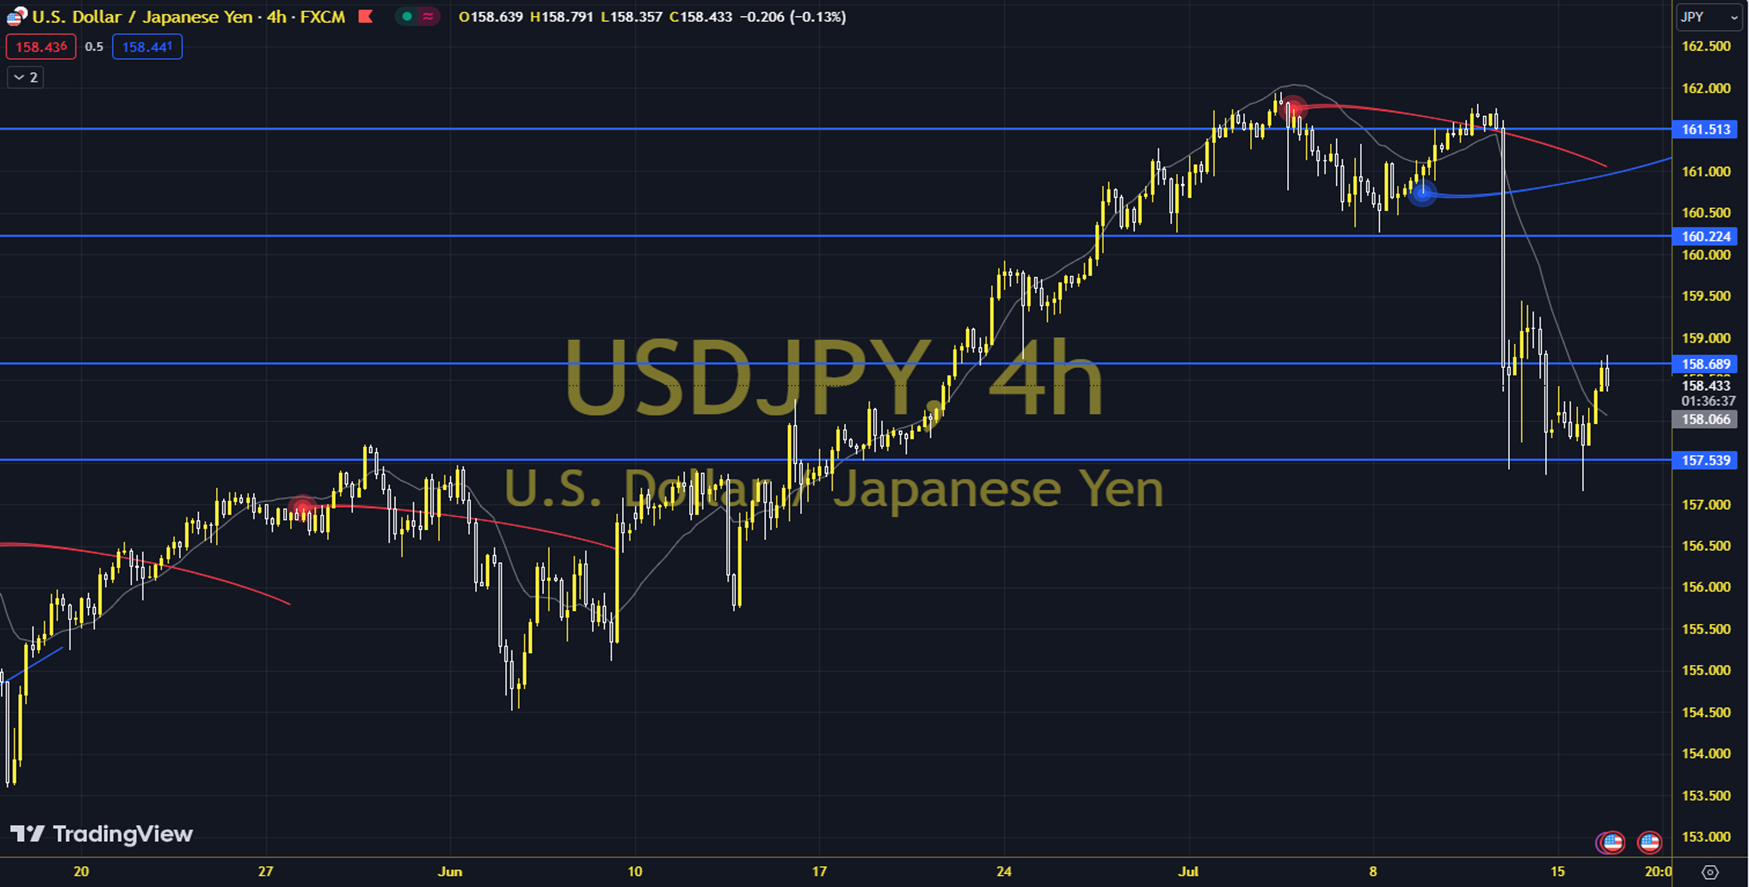
USD/JPY is falling rapidly from its early July highs. After peaking at 161.95 on July 3, it fell more than five Japanese yen to 156.50 on July 17. The breakout of the main trendline at 158.45 on July 13 was a game-changer for the pair, and when taken together with the more recent break below the July low of 157.15, it has given the chart a much more bearish outlook. The pair closed at 157.45 the previous trading day, bringing the daily gain to 0.06%. The pair, which is below its 20-day moving average, has the RSI at 42.15, while its momentum is at 97.38. The 157.35 level is a good place to watch for intraday downsides. If this level is broken, supports at 157.17, 156.90 and 156.72 may become important. In case of possible increases, resistance levels at 157.81 and 158.09 will be monitored. Support: 157.350 – 157.170 Resistance: 156.810 – 158.090