USDJPY
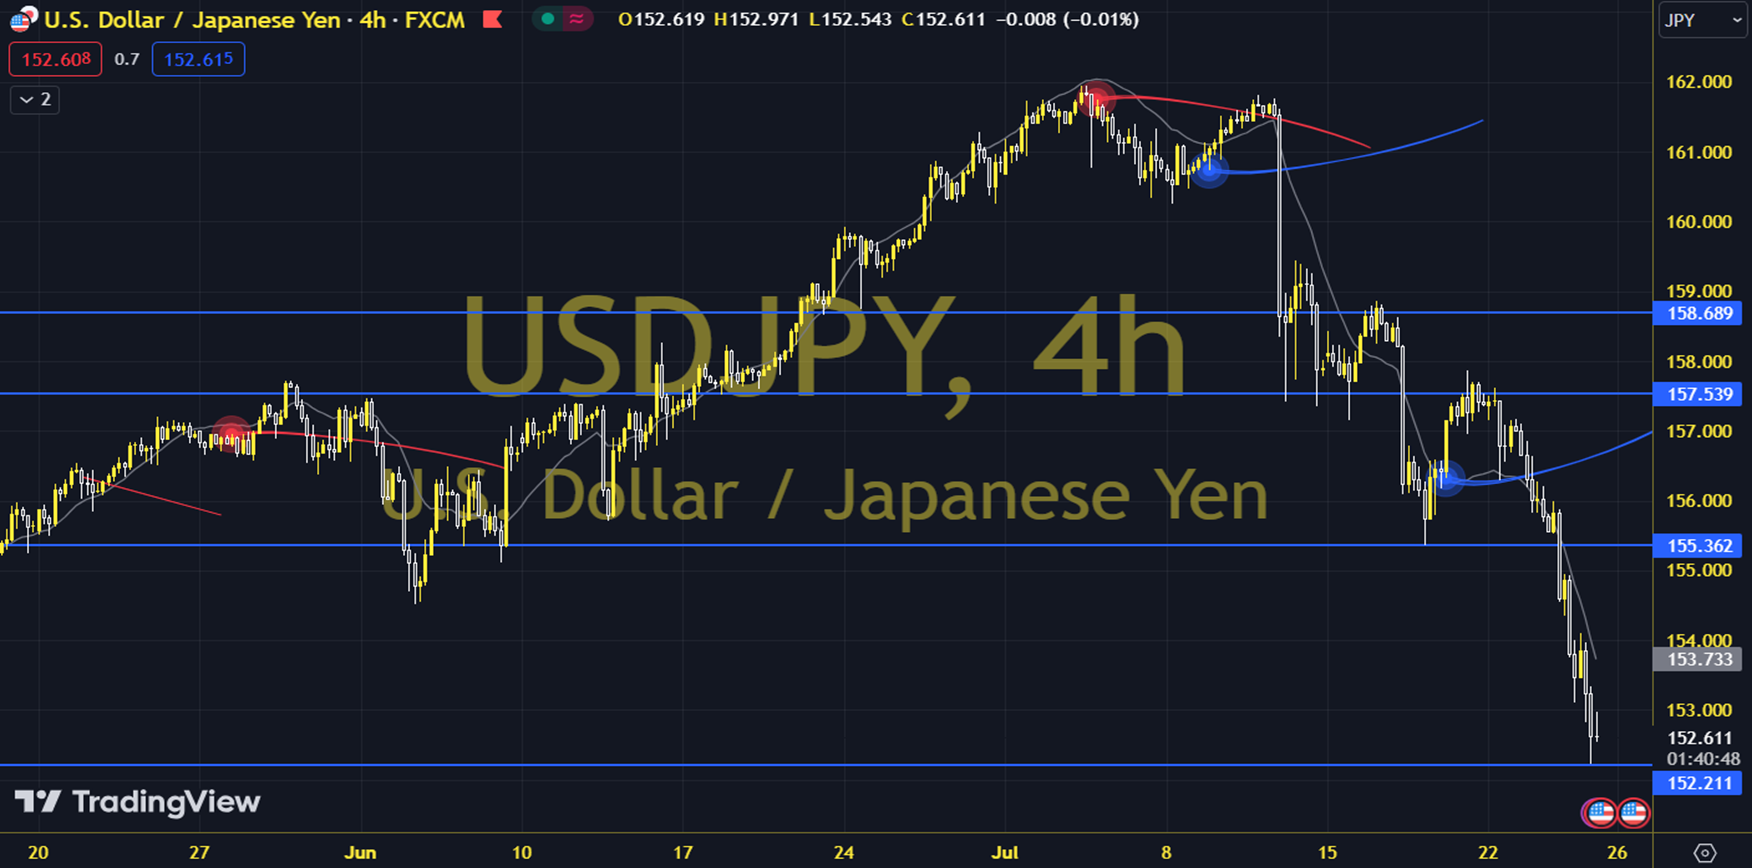
USD/JPY is falling rapidly from its early July highs. After peaking at 161.95 on July 3, it fell to 154.50 on the Japanese Yen intervention. The break of the main trend line at 158.45 on July 13 was a game-changer for the pair, and when taken together with the more recent break below the July low of 152.15, it gave the chart a much more bearish outlook. The pair closed at 153.62 on the previous trading day, with a daily loss of 0.20%. The pair, which is below its 20-day moving average, has an RSI of 27.96, while its momentum is at 95.03. The 153.92 level can be followed for intraday upside. If this level is passed, resistance levels of 154.48 and 154.81 may become important. In case of possible pullbacks, support levels of 153.29, 152.96 and 152.53 will be monitored. Support: 153.290 – 152,960 Resistance: 153.920 – 154.480