NGCUSD
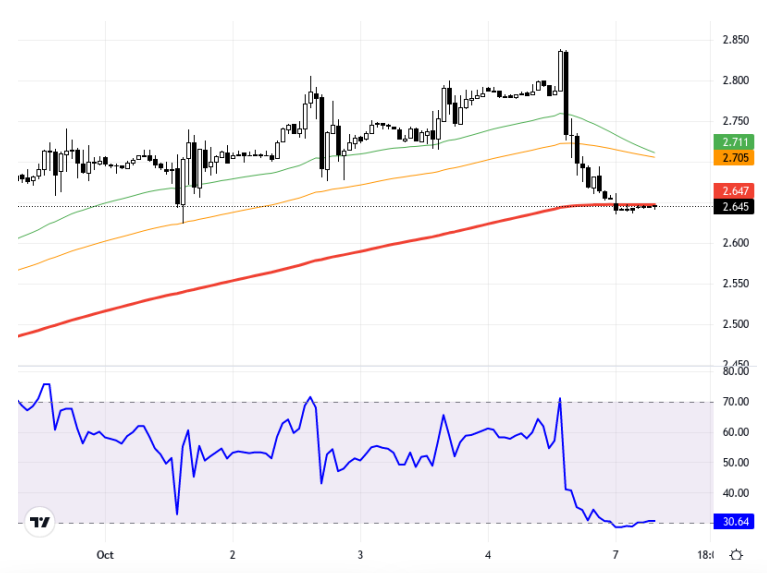
U.S. natural gas futures continue to rise as stock increases fall short of expectations and demand expectations grow. The positive trend in Asian markets is also noteworthy in the new week. Following strong U.S. employment data last week, uncertainty regarding the Fed's interest rate cuts continues, while the U.S. dollar shows a limited decline. With these developments, natural gas prices may see new movements with the opening of European and U.S. markets. The NGCUSD pair is trending upward, staying above the 2.880 - 2.910 support level on the 1-hour chart. If this region is maintained, resistance levels at 3.000 and 3.040 could be targeted in upward movements. The pair is trading at the 2.785 level, with the RSI indicator at 59.91 showing a neutral outlook. The change from the previous day is 0.001%, which is quite limited. Falling below 2.880 during the day could bring lower levels into focus. Support:2.78 - 2.74 - 2.71 - Resistance:2.82 - 2.85 - 2.88 -
ABD doğal gaz vadeli işlemleri, stok artışlarının tahminleri karşılamaması ve artan talep beklentileri ile yükselmeye devam ediyor. Yeni haftada Asya piyasalarının pozitif seyri de dikkat çekiyor. Geçtiğimiz hafta gelen güçlü ABD istihdam verileri ardından Fed'in faiz indirimi konusundaki belirsizlik sürerken, ABD dolarında sınırlı düşüş gözleniyor. Bu gelişmelerle birlikte, doğal gaz fiyatları Avrupa ve ABD piyasalarının açılışıyla birlikte yeni hareketler yapabilir. NGCUSD paritesi, 1 saatlik grafikte, 2,880 – 2,910 destek seviyesi üzerinde kalarak yukarı yönlü bir seyir izliyor. Bu bölge üzerinde kalıcılık sağlanırsa, yukarı yönlü hareketlerde 3,000 ve 3,040 direnç seviyeleri hedeflenebilir. Parite 2,785 seviyesinde işlem görürken, RSI göstergesi 59,91 seviyesinde ve nötr görünüm sergiliyor. Önceki güne göre değişim %0,001 oranında, yani oldukça sınırlı. Günün devamında 2,880 altına sarkmalar, daha düşük seviyelerin test edilmesini gündeme getirebilir. Destek:2.78 - 2.74 - 2.71 - Direnç:2.82 - 2.85 - 2.88 -