BRNUSD
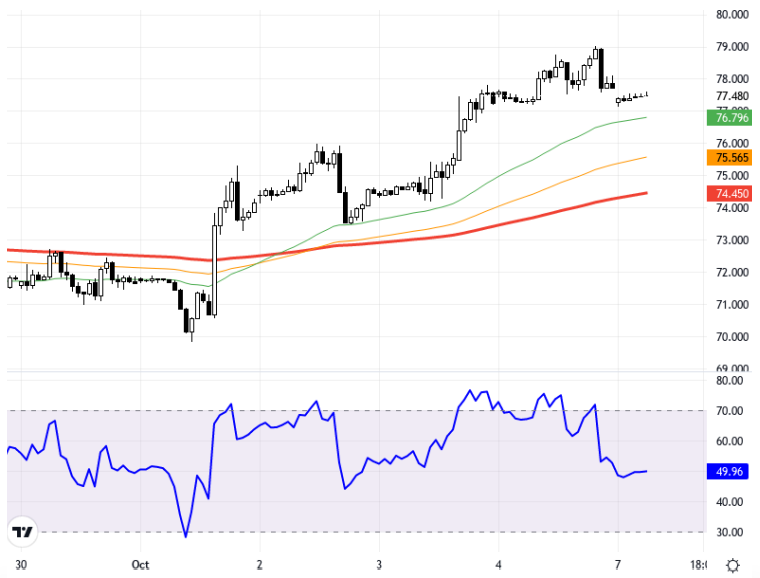
Brent crude oil prices are fluctuating based on the increasing tension between Israel and Iran and the trends in European and US stock markets. Particularly, Israel's attacks on Beirut and the US approach towards Iran's strategic facilities are creating uncertainty in the markets. This situation keeps oil prices above the 76.00 - 76.50 support levels and highlights an upward trend. Additionally, the impact of strong US employment data on FED expectations and the positive atmosphere created by stimulus measures in China indirectly affect oil prices. In terms of technical outlook, on the 1-hour chart, Brent crude oil prices are trading at $77.30. For prices maintaining above the 76.00 - 76.50 support range, the targets can be the 78.00 and 78.50 resistance levels. In downward movements, a fall below the 76.00 level could pull prices back to the 75.50 and 75.00 support levels. The RSI indicator is at 67.11, showing a positive trend. A limited decline of 0.02% is observed compared to the previous day. However, it is possible to say that the general trend is positive. Support:77.5 - 77 - 76.5 - Resistance:78 - 78.5 - 79 -
Brent petrol fiyatları, İsrail ile İran arasında artan gerilim ve Avrupa ile ABD borsalarının seyrine bağlı olarak dalgalı bir seyir izliyor. Özellikle İsrail’in Beyrut'a yönelik saldırıları ve İran'ın stratejik tesislerine karşı ABD’nin yaklaşımı piyasalarda belirsizlik yaratmakta. Bu durum, petrol fiyatlarının 76,00 - 76,50 destek seviyeleri üzerinde kalmasını sağlıyor ve yukarı yönlü bir görünümü ön plana çıkarıyor. Bununla birlikte, ABD’nin güçlü istihdam verilerinin FED beklentileri üzerindeki etkileri ve Çin’deki teşvik adımlarının yarattığı olumlu hava da petrol fiyatları üzerinde dolaylı bir etkide bulunuyor. Teknik görünüme geldiğimizde, 1 saatlik grafikte Brent petrol fiyatları 77.30 dolardan işlem görmekte. 76.00 - 76.50 destek aralığının üzerinde tutunan fiyatlar için 78.00 ve 78.50 direnç seviyeleri hedeflenebilir. Aşağı yönlü hareketlerde 76.00 seviyesinin altına düşüş, fiyatları 75.50 ve 75.00 destek seviyelerine çekebilir. RSI göstergesi 67.11 seviyesinde olup pozitif bir eğilim göstermekte. Önceki güne göre %0.02’lik sınırlı bir geri çekilme görülüyor. Ancak, genel trendin pozitif olduğunu söylemek mümkün. Destek:77.5 - 77 - 76.5 - Direnç:78 - 78.5 - 79 -