NGCUSD
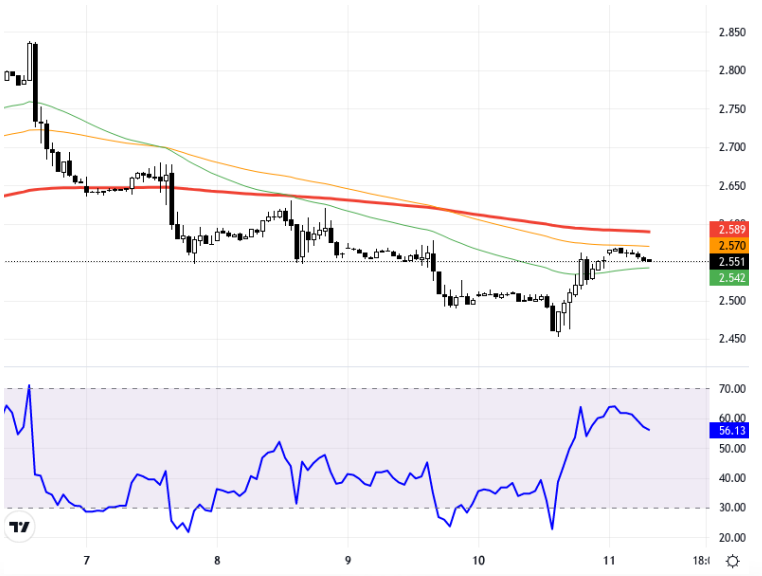
U.S. natural gas futures continue their downward trend due to the impact of Hurricane Milton. This decline stems from the potential negative effects of the hurricane, especially on demand. While developments related to the hurricane continue, the trajectory of European and U.S. stock markets may also influence pricing. Currently, as long as prices remain below the 2.780 – 2.820 resistance levels, a downward outlook may prevail. In potential declines, the 2.675 and 2.650 levels can be targeted. However, for a potential recovery, the continuation of the rise requires movement above 2.820 and the occurrence of 4-hour closes. Looking at the technical outlook, the NGC/USD pair traded on an hourly timeframe is below the 50-hour EMA at the level of 2.603, and it is also below longer-term averages. In downward movements, the first support is at 2.565, followed by the 2.550 level. In upward movements, the 2.603 and 2.662 resistance levels are noteworthy. The RSI indicator is at 44.46, showing a neutral outlook. It is trading at 2.551 with a 0.20% change during the day. Support:2.65 - 2.61 - 2.58 - Resistance:2.71 - 2.74 - 2.78 -
ABD doğal gaz vadeli işlemleri, Milton kasırgasının etkisiyle gerileme eğilimini sürdürüyor. Bu gerileme, kasırganın özellikle talep üzerinde yaratabileceği olumsuz etkilerden kaynaklanmakta. Kasırgayla ilgili gelişmeler devam ederken, Avrupa ve ABD borsalarının seyri de fiyatlamalar üzerinde etkili olabilir. Mevcut durumda fiyatlar, 2,780 – 2,820 direnç seviyeleri altında kaldığı sürece aşağı yönlü görünüm ön planda olabilir. Olası düşüşlerde 2,675 ve 2,650 seviyeleri hedeflenebilir. Ancak olası toparlanmalarda, yükselişin devamı için 2,820 üzerindeki seyri ve 4 saatlik kapanışların görülmesi gerekmektedir. Teknik görünüme baktığımızda, bir saatlik zaman diliminde işlem gören NGC/USD paritesi 2,603 seviyesindeki 50 saatlik EMA'nın altında seyrederken, daha uzun vadeli ortalamaların da altında bulunuyor. Aşağı yönlü hareketlerde ilk destek 2,565 seviyesinde, ardından 2,550 seviyesi takip edilebilir. Yukarı yönlü hareketlerde ise 2,603 ve 2,662 direnç seviyeleri dikkat çekiyor. RSI göstergesi 44,46 seviyesinde olup, nötr bir görünüm sergiliyor. Gün içinde %0,20'lik bir değişimle 2,569 seviyesinde işlem görüyor. Destek:2.65 - 2.61 - 2.58 - Direnç:2.71 - 2.74 - 2.78 -