OILWTI - USDCAD
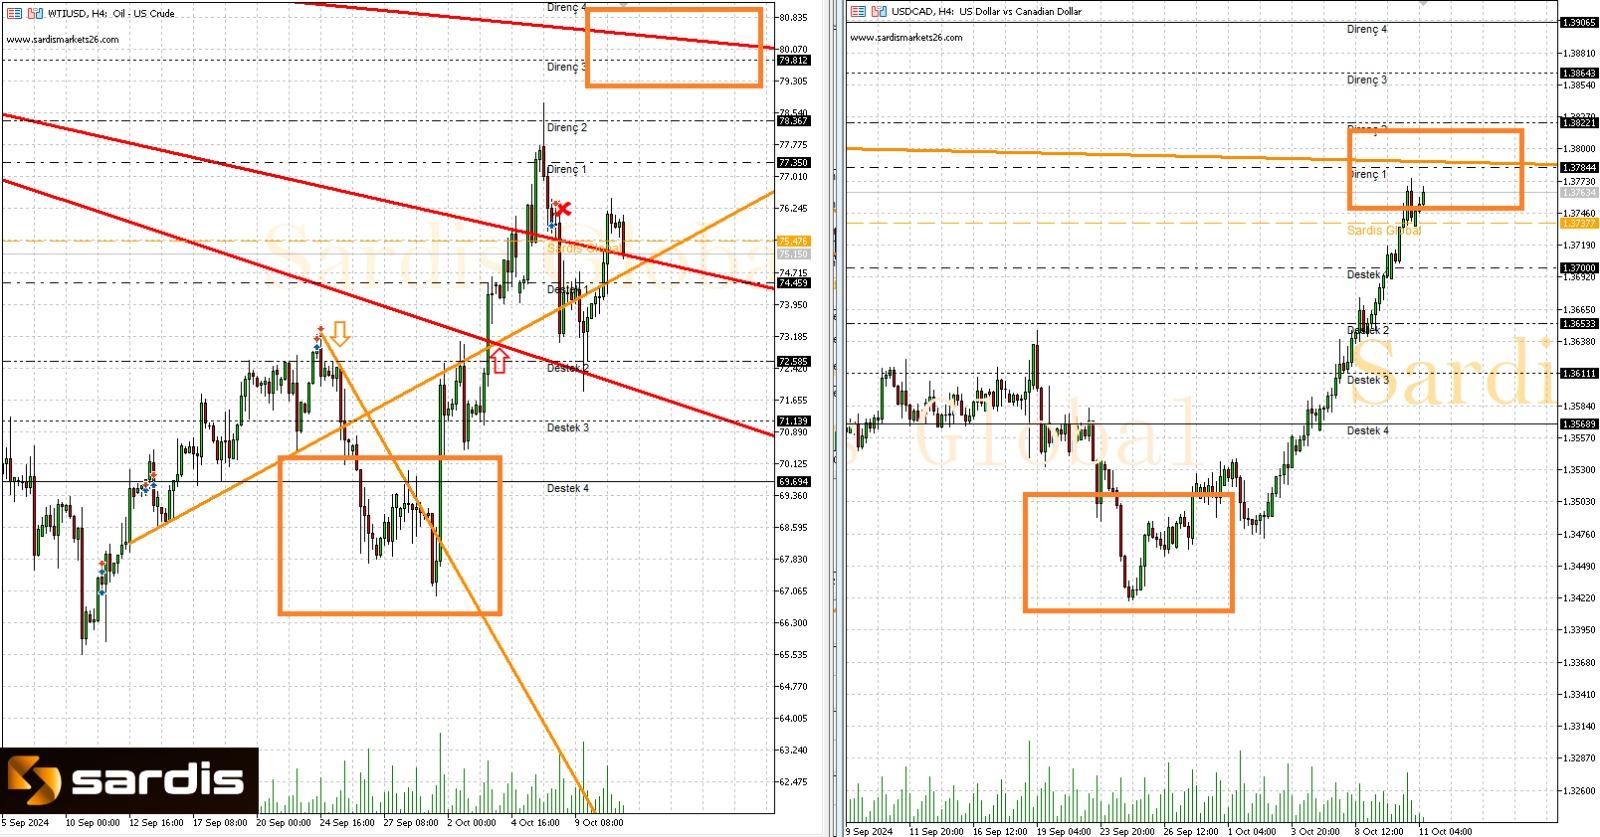
In the case of the USDCAD pair, which shows a correlation with oil, it is observed that sharp increases occur more rapidly compared to oil. The primary reason for oil's lag can be attributed to the high inventory levels. The areas marked with squares on the chart clearly demonstrate whether price adjustments based on the correlation have occurred. Although it seems unreasonable for oil prices driven by inventories to strengthen, it can be anticipated that if the upward trend in the USDCAD pair is disrupted, there may be continued pullbacks in oil. For oil, the technical levels to watch are 77.350 to 74.459, while for USDCAD, they are 1.3784 to 1.3737. As Canadian data is released today at 3:30 PM (Eastern Standard Time), it may lead to high volatility during trading, so positions should be evaluated accordingly.