NGCUSD
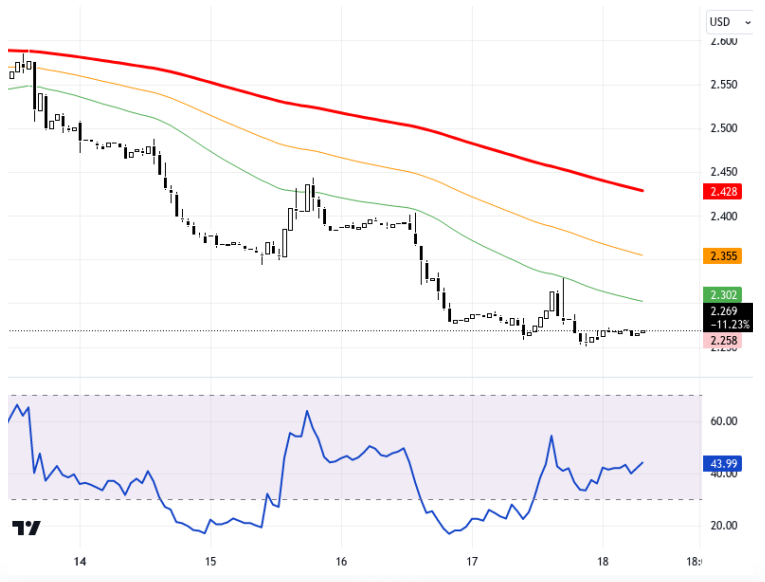
U.S. natural gas futures are under pressure from weak demand due to power outages and the impact of hot weather following Hurricane Milton. The European Central Bank's interest rate cut and strong retail sales data announced in the U.S. also stirred market activity. While the Asian indices show mixed trends, the rising yields of U.S. 10-year bonds continue to support the dollar. Under these conditions, the selling pressure on the NGC/USD pair is supported by various factors. In the chart, the NGC/USD pair is monitored on an hourly timeframe. The levels of 2.33, 2.3, and 2.275 are notable support zones, while resistances are positioned at 2.355, 2.38, and 2.41. The RSI indicator stands at 43.99, displaying a negative outlook. In light of this data, a picture emerges where the downward trend continues, but recovery efforts should not be overlooked. Support:2.33 - 2.3 - 2.275 - Resistance:2.355 - 2.38 - 2.41 -
ABD doğal gaz vadeli işlemleri, Milton Kasırgası sonrası görülen elektrik kesintileri ve sıcak hava etkisiyle talep tarafındaki zayıflığın baskısı altında kalmış durumda. Avrupa Merkez Bankası'nın faiz indirimi ve ABD'de açıklanan güçlü perakende satış verileri de piyasalarda hareketlilik yarattı. Asya endekslerinde karışık seyir sürerken, ABD 10 yıllık tahvil getirilerinin yükselmesi doları desteklemeye devam ediyor. Bu koşullar altında, NGC/USD paritesinde satış baskısı farklı faktörler tarafından destekleniyor. Grafikte NGC/USD paritesi saatlik zaman diliminde izlenmekte. 2.33, 2.3 ve 2.275 seviyeleri önemli destek bölgeleri olarak dikkat çekerken, dirençler 2.355, 2.38 ve 2.41 seviyelerinde konumlanmış durumda. RSI göstergesi ise 43.99 seviyesinde olup negatif bir görünüm sergiliyor. Bu veriler ışığında, düşüş eğiliminin sürdüğü fakat toparlanma çabalarının da göz ardı edilmemesi gerektiği bir tablo ortaya çıkıyor. Destek:2.33 - 2.3 - 2.275 - Direnç:2.355 - 2.38 - 2.41 -