WTIUSD
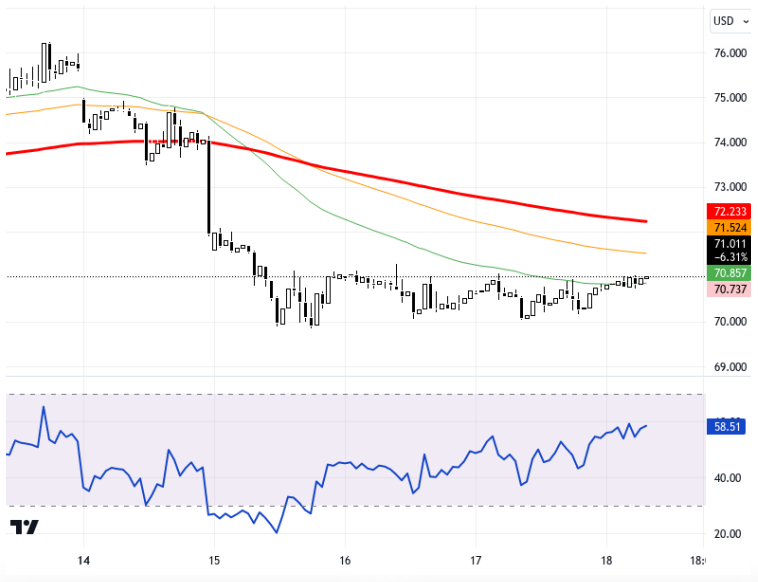
Oil prices continue to fluctuate due to concerns about supply from the Middle East not yet coming into play and weakness in global demand expectations. Additionally, the European Central Bank's interest rate cut and better-than-expected retail sales in the US have strengthened the dollar index, which could affect oil price movements. The mixed trend in Asian markets and changes in US 10-year bond yields may indirectly impact the trajectory of WTI. Technically, when the WTIUSD chart is examined on an hourly timeframe, it is observed that the price faces resistance at the 70.5 level. The current price is at 70.737, showing a 0.89% increase compared to the previous day's price. As long as it stays above the 70 level, the upward trend is expected to continue. In downward movements, the levels of 70, 69.5, and 69 can be monitored as short-term support points. The RSI indicator is at 58, displaying a positive outlook, indicating a slight increase in buying appetite. However, for a stronger rise, it may be important to see closings above the 71 level. Support:70 - 69.5 - 69 - Resistance:70.5 - 71 - 71.5 -
Petrol fiyatları, Orta Doğu'daki arz endişelerinin henüz devreye girmemesi ve küresel talep beklentilerindeki zayıflık nedeniyle dalgalı bir seyir izlemeye devam ediyor. Buna ek olarak, Avrupa Merkez Bankası'nın faiz indirimi ve ABD'de perakende satışların beklenenden iyi gelmesi, dolar endeksinin güç kazanmasına neden oldu ve bu durum, petrol fiyatlarının hareketlerini etkileyebilecek bir gelişmeydi. Asya borsalarının karışık seyri ve ABD 10 yıllık tahvil faizlerindeki değişimler, WTI'nin seyrine dolaylı etki edebilir. Teknik olarak WTIUSD grafiği saatlik zaman diliminde incelendiğinde, fiyatın 70.5 seviyesindeki dirençle karşılaştığı görülüyor. Anlık fiyat 70.737'de olup, önceki günün fiyatına göre %0.89 artış göstermiş durumda. 70 seviyesinin üzerinde kaldığı sürece, alıcılı seyrin devam edebileceği düşünülüyor. Aşağı yönlü hareketlerde 70, 69.5 ve 69 seviyeleri kısa vadeli destek noktaları olarak izlenebilir. RSI göstergesi 58 seviyesinde ve pozitif bir görünüm sergiliyor, bu da alım iştahının bir miktar arttığına işaret ediyor. Ancak, daha güçlü bir yükseliş için 71 seviyesinin üzerinde kapanışların görülmesi önem taşıyabilir. Destek:70 - 69.5 - 69 - Direnç:70.5 - 71 - 71.5 -