USDTRY
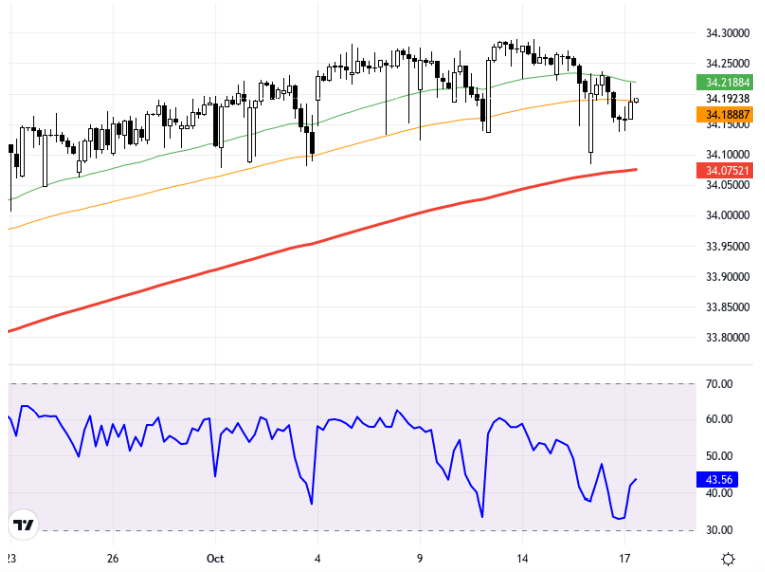
The USD/TRY pair is influenced by the performance of emerging market currencies against the US Dollar in the morning hours. It is noteworthy that the Turkish Lira remains in a weak position, especially when compared to the Thai Baht and the Russian Ruble. In the early hours of the day, the Turkish Lira is trading with a depreciation of 0.04%. The exchange rate is currently hovering around the 34.27 levels. Within the framework of the Envelope indicator, the rate tends to maintain its positive outlook as long as it stays above the 34.09 level. Under this condition, it may find room to move towards the resistance levels of 34.30, 34.37, and 34.44. Moreover, sustained movements above 34.44 could lead to further levels. Technically, USD/TRY is being examined on a 4-hour chart. The levels of 34.23, 34.16, and 34.09 are monitored as support areas, while the resistance levels are determined as 34.30, 34.37, and 34.44, respectively. The RSI indicator is at 42 and shows a slightly negative outlook. There is a 0.01% decline in the pair compared to the previous day. The current price continues to trade at the 34.19 level. Support:34.16 - 34.09 - 34.02 - Resistance:34.23 - 34.3 - 34.37 -
USD/TRY paritesi, sabah saatlerinde gelişmekte olan ülke para birimlerinin ABD Doları karşısındaki performanslarından etkileniyor. Özellikle Taylor Bahtı ve Rus Rublesi ile kıyaslandığında Türk Lirası'nın zayıf konumda kaldığı dikkat çekiyor. Türk Lirası, günün ilk saatlerinde yüzde 0,04'lük değer kaybıyla işlem görmekte. Kur, hali hazırda 34,27 seviyelerine yakın seyrediyor. Envelop göstergesi çerçevesinde kur, 34,09 seviyesinin üzerinde kaldığı sürece olumlu görünümünü sürdürme eğiliminde. Bu koşulda, 34,30, 34,37 ve 34,44 direnç seviyelerine doğru hareket alanı bulabilir. Bununla birlikte, 34,44 üzerindeki kalıcı hareketler daha ileri seviyelere taşınabilir. Teknik olarak, USD/TRY 4 saatlik grafikte inceleniyor. 34,23, 34,16 ve 34,09 seviyeleri destek alanları olarak izlenirken, direnç seviyeleri sırasıyla 34,30, 34,37 ve 34,44 olarak belirlenmiş durumda. RSI göstergesi 42 seviyesinde ve hafif negatif bir görünüm sergiliyor. Önceki güne göre paritede yüzde 0,01'lik düşüş görülmekte. Güncel fiyat 34,22 seviyesinde işlem görmeye devam ediyor. Destek:34.16 - 34.09 - 34.02 - Direnç:34.23 - 34.3 - 34.37 -