GBPUSD
While monetary policy movements in the US and ECB remain at the forefront with swap market pricing, this situation affects the general trend of the GBPUSD pair. Expectations for the upcoming rate cut by the ECB, especially with potential guidance from ECB President Lagarde, are the focus of the market. It should be noted that the CPI data monitored in the UK and Lagarde's speech from the Eurozone could cause fluctuations in the forex markets. Despite the US Dollar's efforts to strengthen, its impact on the pair may remain limited as long as it fails to hold above the 233-day average. In the 4-hour chart, the GBPUSD pair is trading below the 100-period moving average, near the 1.3135 resistance. While 1.3030, 1.2990, and 1.2945 levels can be monitored as support, the resistance levels of 1.308, 1.3135, and 1.318 are important in upward movements. The RSI indicator is at 54, showing a neutral market outlook. The daily change shows a minimal decrease of 0.002%, with the current price at 1.3079. We may need to see a sustained move above 1.3135 to initiate an upward movement in the pair. However, if the pressure persists, movements towards lower support levels may be observed. Support:1.294 - 1.2865 - 1.282 - Resistance:1.303 - 1.308 - 1.3135 -
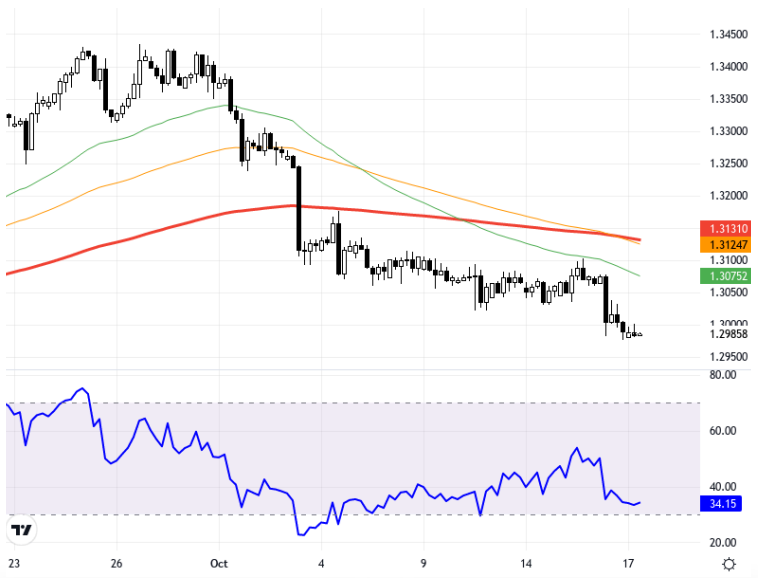
GBP/USD paritesi, İngiltere'de manşet TÜFE verisinin %1,7'ye gerilemesinin ardından BoE’nin faiz indirimi beklentileriyle baskı altında kalmaya devam ediyor. İngiltere'nin makroekonomik verileri, enflasyon düşüşü ve dolardaki güçlenme eğilimi parite üzerindeki negatif görüşü pekiştiriyor. Ek olarak, ECB’nin faiz indirim kararları ve Lagarde'ın konuşmaları, dolar endeksi üzerindeki etkileriyle GBP/USD paritesini doğrudan etkileyebilir. Genel anlamda, hem Fed hem de ECB tarafındaki belirsizliklerin paritenin görünümü üzerinde önemli bir etkisi bulunmaktadır. Teknik analiz açısından, GBP/USD paritesi 4 saatlik grafikte, 1.2940 ve 1.2900 destek seviyelerine doğru gerileyebilir. 1.3030, 1.3080 ve 1.3135 seviyeleri ise direnç olarak izlenebilir. RSI göstergesi 34 seviyesinde olup negatif bir görünümde seyrediyor. Bir önceki güne göre %0.0026'lık hafif bir düşüş ile 1.2987 seviyesinden işlem görüyor. Paritenin mevcut durumda EMA 50, EMA 100 ve EMA 200'ün altında olması, düşüş eğiliminin devam edebileceğini gösterebilir. Destek:1.294 - 1.2865 - 1.282 - Direnç:1.303 - 1.308 - 1.3135 -