NGCUSD
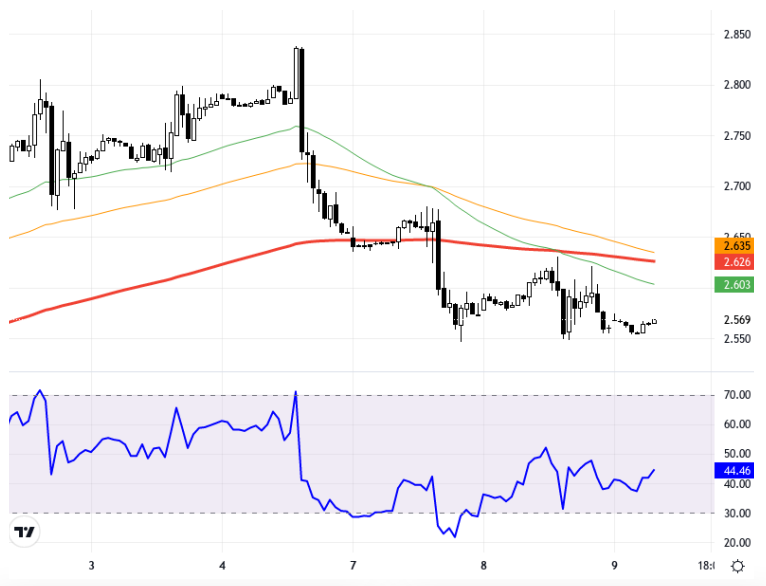
US natural gas futures are trending downward due to the oversupply despite storage increasing less than expected. The trajectory of European and US stock markets can be a significant factor here. In downward movements, the 2.780 and 2.740 levels are monitored, while in potential recoveries, the 2.820- 2.850 resistance zone stands out. For the rise to continue, it may be necessary to stay above the 2.850 level. However, as long as there are no sustained movements above the 2.850 resistance, the potential for a downward trend is considered to continue. From a technical perspective on the chart, the NGCUSD pair is trading on a 1- hour time frame, with 2.705 and 2.711 levels standing out as potential resistance points. The 100-hour simple moving average is exerting pressure on the price. The RSI indicator is at 30.64 and is hovering near the oversold zone, which may increase the likelihood of a rebound in the short term. According to the last close, the pair has shown no change, with the current price at the 2.645 level. With this data, it is observed that the technical outlook of the pair is dominated by a sideways trend. Support:2.675 - 2.65 - 2.61 - Resistance:2.74 - 2.78 - 2.82 -
ABD doğal gaz vadelileri, stokların beklentinin altında artmasına rağmen arz fazlasının etkisiyle gerileme eğilimi gösteriyor. Avrupa ve ABD borsalarının seyri burada önemli bir etken olabilir. Aşağı yönlü hareketlerde 2,780 ve 2,740 seviyeleri izlenirken, olası toparlanmalarda 2,820–2,850 direnç bölgesi dikkat çekiyor. Yükselişin devamı için 2,850 seviyesinin üstünde kalıcı olunması gerekebilir. Ancak, 2,850 direncinin üzerinde kalıcı hareketler görülmediği sürece aşağı yönlü potansiyelin devam edebileceği değerlendiriliyor. Grafik üzerinde teknik açıdan değerlendirdiğimizde, NGCUSD paritesi 1 saatlik zaman diliminde işlem görmekte olup, 2.705 ve 2.711 seviyeleri izlenebilir direnç noktaları olarak öne çıkıyor. 100 saatlik basit hareketli ortalama, fiyatın üzerinde baskı yaratıyor. RSI göstergesi 30.64 seviyesinde ve aşırı satım bölgesine yakın seyrediyor, bu da kısa vadede bir tepki yükselişinin gerçekleşme olasılığını artırabilir. Son kapanışa göre parite %0 oranında değişim göstermemiş olup, güncel fiyatı 2.645 seviyesinde. Bu veriler eşliğinde, paritenin teknik görünümünde yatay bir seyrin hakim olduğu gözlemleniyor. Destek:2.675 - 2.65 - 2.61 - Direnç:2.74 - 2.78 - 2.82 -