GBPUSD
The GBP/USD pair, influenced by global developments, is closely related to changes in the Dollar Index and expectations regarding the Fed's interest rate policy. The disappointment with the expected stimulus from China and the global markets' reaction to this situation are affecting the pair. Discussions on interest rate cuts in the U.S. continue to be an important factor for GBP/USD by causing fluctuations in the Dollar. In addition to global economic developments, geopolitical tensions in the Middle East also affect market sentiment, creating uncertainty about the direction of the pair. From a technical perspective, the GBP/USD pair, examined on the 4-hour chart, remains below the 100-period moving average in the 1.3220 region and is currently trading at the 1.3089 level. This indicates that the downward pressure on the pair continues. The 1.3080 level is a significant support point, and a break below it could lead to a retreat to the 1.3030 and 1.2990 levels. In upward movements, the first resistance area is monitored at the 1.3170 level, while the RSI indicator is at 35.94, close to the oversold zone, showing a negative outlook. This suggests further downside potential in the short term. The fact that the pair has declined by 0.02% compared to the previous day indicates that the current weakness trend is continuing. Support:1.308 - 1.303 - 1.299 - Resistance:1.3135 - 1.318 - 1.322 -
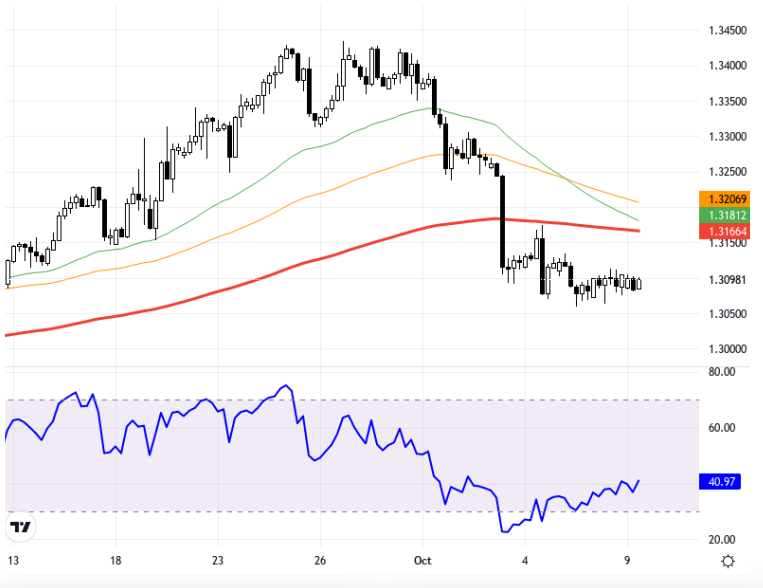
GBP/USD paritesi, ABD'den gelen güçlü istihdam verileri sonrası Fed'in faiz indirim beklentilerinin değişmesiyle baskı altında kalıyor. Fed'in faiz indirim beklentilerinin 25 baz puan düzeyine çekilmesi ve Çin ekonomisinde teşviklerin yetersiz kalması gibi faktörler piyasa üzerinde etkili oluyor. ABD'de yaklaşan enflasyon verileri, paritenin yönü üzerinde belirleyici olabilir. Dolar endeksindeki yeni pozitif eğilim, sterlin üzerinde baskı oluşturmaya devam edebilir. 4 saatlik grafikte, GBP/USD paritesi 1,3180 - 1,3220 seviyelerindeki 100 periyotluk ortalamaların altında işlem görüyor ve bu seviyelerin altındaki hareket devam ederse parite 1,3080, 1,3030 ve 1,2990 destek seviyelerine doğru gerileyebilir. RSI göstergesi 41,24 seviyesinde olup negatif bir görünüm sergiliyor. Günlük %0,01'lik hafif bir artış göstermektedir. Şu anki güncel fiyat ise 1,3091 seviyesinde seyrediyor. Destek:1.308 - 1.303 - 1.299 - Direnç:1.3135 - 1.318 - 1.322 -