WTI
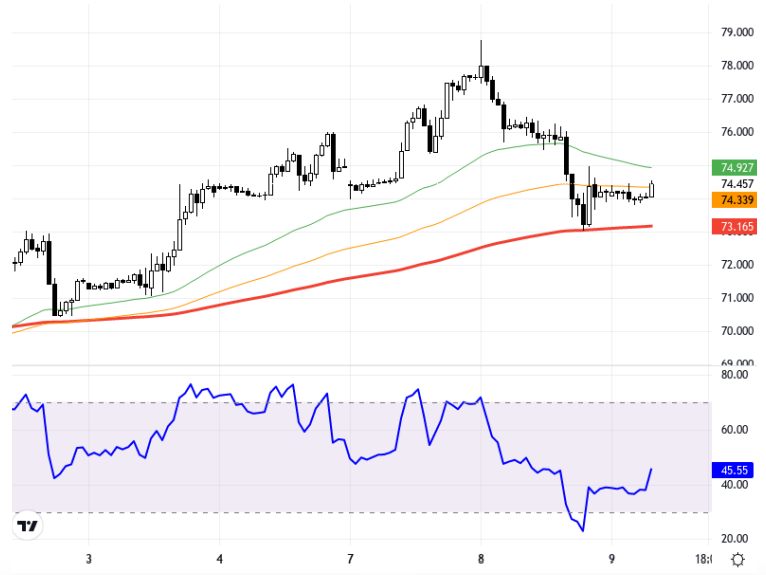
WTI oil prices are moving under the influence of geopolitical tensions in the Middle East and developments in the Chinese economy. While the tensions between Israel and Iran continue to create upward pressure on oil prices, the lack of expected stimuli after the holiday in China has led to a decrease in global risk appetite. This situation caused losses in Asian markets like Japan's Nikkei and Hang Seng. On the U.S. side, uncertainties regarding interest rate cuts and employment data stand out as important factors that could influence the direction of the markets. All these developments continue to determine the course of oil prices. From a technical analysis perspective, when examining the WTI oil chart in the hourly time frame, prices continue to stay above the support levels of 73.50 - 74.00. In the continuation of upward movements, resistance levels of 74.50 and 75.00 can be monitored. The RSI indicator shows a neutral trend at level 51. The change compared to the previous day is at a level of 0.02%, and the current price is at 74.516. In the event of a closure below the support level, a pullback towards 73.00 and 72.50 levels can be observed. Support:73 - 72.5 - 72 - Resistance:74.5 - 75 - 75.5 -
WTI petrol fiyatları, Orta Doğu'daki jeopolitik gerilimler ve Çin ekonomisindeki gelişmelerin etkisi altında hareket ediyor. İsrail ve İran arasındaki gerilimler, petrol fiyatları üzerinde yukarı yönlü baskı oluşturmaya devam ederken, Çin'deki tatil sonrası beklenen teşviklerin gerçekleşmemesi, küresel risk iştahında azalmaya neden oldu. Bu durum, Japon Nikkei ve Hang Seng gibi Asya borsalarında kayıplara yol açtı. ABD tarafında ise, faiz indirimine dair belirsizlikler ile istihdam verileri piyasaların yönünü etkileyebilecek önemli unsurlar olarak öne çıkıyor. Tüm bu gelişmeler petrol fiyatlarının seyrini belirlemeye devam ediyor. Teknik analiz açısından, WTI petrol grafiği saatlik zaman diliminde incelendiğinde, fiyatlar 73.50 - 74.00 destek seviyeleri üzerinde kalmaya devam ediyor. Yukarı yönlü hareketlerin devamında, 74.50 ve 75.00 direnç seviyeleri izlenebilir. RSI göstergesi ise 51 seviyesinde, nötr bir eğilim gösteriyor. Önceki güne göre değişim %0.02 düzeyinde olup, fiyat güncel olarak 74.516 seviyesinde seyrediyor. Destek seviyesinin altında bir kapanışın gerçekleşmesi durumunda ise 73.00 ve 72.50 seviyelerine doğru bir geri çekilme gözlemlenebilir. Destek:73 - 72.5 - 72 - Direnç:74.5 - 75 - 75.5 -