NDXUSD
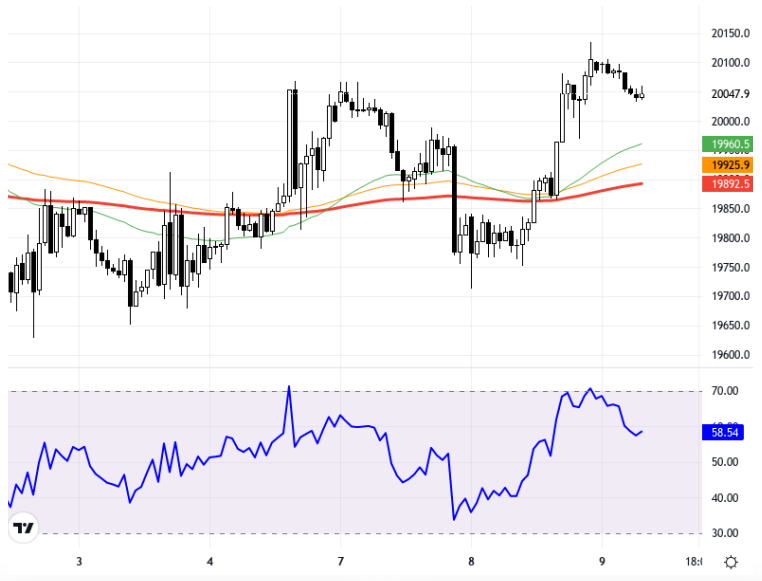
The NASDAQ100 index is in search of equilibrium in the markets as strong U.S. employment data presents a robust outlook and expectations for the Fed’s rate cut pace slow down. The employment data exceeding expectations slightly reduced uncertainty regarding the Fed’s interest rate policies, creating a stabilizing effect on the index. While unmet stimulus expectations following the holiday in China caused a decline in Asian markets, a limited impact is observed globally. Within this framework, the NASDAQ100 is demonstrating a stable outlook in the short term. On the hourly chart, the NASDAQ100 index appears to have fallen below the 50-day moving average at the 20092 level and is trying to hold above this level. At its current levels, the index is attempting to gain upward momentum by monitoring the 19990 and 19867 support regions. The initial resistance levels to note are 20250 and 20350. The RSI indicator is at 56.44, presenting a positive outlook and suggesting that the index may shift from a neutral trend to an upward movement. The current price of the index is determined at 19996.2, showing a 6.11% decrease compared to the previous day’s close. Support:20150 - 20000 - 19900- Resistance:20350 - 20500 - 20650 -
NASDAQ100 endeksi, ABD istihdam verilerinin güçlü görünüm sunması ve Fed’in faiz indirim hızına dair beklentilerin yavaşlaması ile piyasalarda bir denge arayışı içinde. İstihdam verilerinin beklentilerin üstünde çıkması, Fed’in faiz politikalarına dair belirsizliği bir miktar azaltarak endeks üzerinde dengeleyici etki yarattı. Çin’deki tatil sonrası teşvik beklentilerinin karşılanmamış olması Asya piyasalarında bir düşüş yaratırken, küresel düzeyde sınırlı da olsa bir etki gözleniyor. Bu çerçevede, NASDAQ100 kısa vadede istikrarlı bir görünüm sergiliyor. Saatlik grafik üzerinde NASDAQ100 endeksi, 20092 seviyesindeki 50 günlük hareketli ortalamanın altına inmiş gibi görünüyor ve bu seviyenin üzerine tutunmaya çalışıyor. Endeks bulunduğu seviyelerde, 19990 ve 19867 destek bölgelerini izleyerek, yukarı yönlü ivme kazanmayı deniyor. Direnç olarak ilk seviyeler ise 20250 ve 20350 olarak dikkat çekiyor. RSI göstergesi 56.44 seviyesinde, pozitif bir görünüm sunuyor ve endeksin nötr bir seyirden yukarı yönlü bir harekete yönelebileceğini gösteriyor. Endeksin güncel fiyatı 19996.2 olarak belirlenmiş durumda ve bir önceki gün kapanışına göre %6.11'lik bir düşüş göstermekte. Destek:20150 - 20000 - 19900 - Direnç:20350 - 20500 - 20650 -