NGCUSD
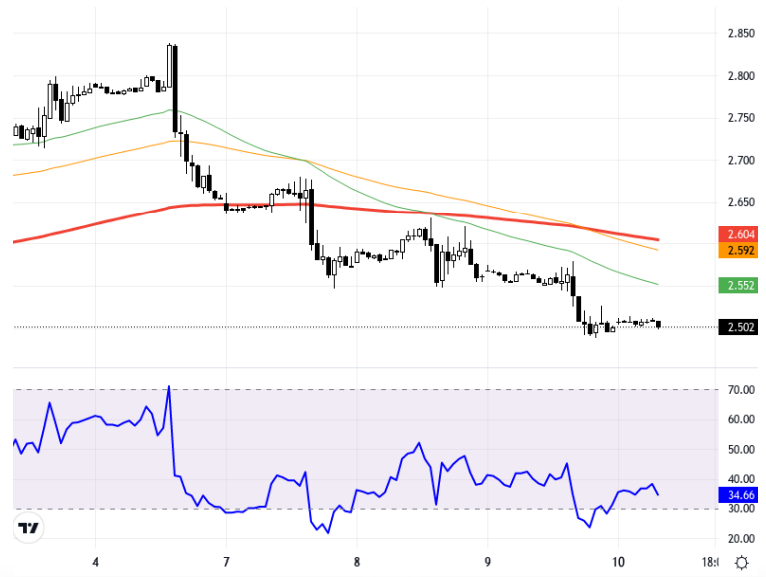
U.S. natural gas futures are showing a downward trend due to the approach of Hurricane Milton towards Florida. The adverse conditions that hurricanes can create on demand are putting pressure on natural gas prices. Throughout the day, the trajectory of European and U.S. stock exchanges may also influence pricing. Analysts indicate that as long as it stays below the 2.780 – 2.820 resistance levels, downward movements are more likely. If prices cannot surpass these resistance levels, lower levels such as 2.675 and 2.650 may be targeted. However, if recovery trends are observed, it may be possible to target the 2.850 and 2.880 levels if there are sustainable closures above 2.820. From a technical analysis perspective, the NGCUSD pair is being monitored on the 1-hour chart. After stalling at the 2.668 resistance level during the day, the pair is testing the supports at 2.638 and 2.600 levels. The RSI indicator is at 39, showing a negative outlook. The price, which has decreased by 0.12% compared to the previous day, is currently trading at around 2.590 levels. These technical indicators may suggest that the selling pressure on the pair could continue to have an impact. Support:2.61 - 2.58 - 2.54 - Resistance:2.675 - 2.71 - 2.74 -
ABD doğal gaz vadeli işlemleri, Florida’ya yaklaşan Milton kasırgasının etkisiyle gerileme eğilimi gösteriyor. Kasırgaların talep üzerinde oluşturabileceği olumsuz koşullar, doğal gaz fiyatları üzerinde baskı yaratıyor. Gün içerisinde Avrupa ve ABD borsalarının seyri de fiyatlamalar üzerinde etkili olabilir. Analistler, 2,780 – 2,820 direnç seviyelerinin altında kalındığı sürece aşağı yönlü hareketlerin daha olası olduğunu belirtiyor. Eğer fiyatlamalar bu direnç seviyelerini aşamazsa, 2,675 ve 2,650 gibi daha düşük seviyeler hedeflenebilir. Ancak toparlanma eğilimleri görülürse, 2,820'nin üzerinde sürdürülebilir kapanışların yaşanması durumunda 2,850 ve 2,880 seviyelerinin hedeflenmesi mümkün olabilir. Teknik analiz açısından, NGCUSD paritesi 1 saatlik grafikte izleniyor. Parite gün içerisinde 2,668 seviyesi direncinde takıldıktan sonra, 2,638 ve 2,600 seviyelerindeki destekleri test ediyor. RSI göstergesi 39 seviyesinde bulunarak negatif bir görünüm sergiliyor. Önceki güne göre %0.12 oranında bir azalış gösteren fiyat, güncel olarak 2,590 seviyelerinden işlem görüyor. Bu teknik göstergeler, paritede satış baskısının etkisini sürdürebileceğine işaret edebilir. Destek:2.61 - 2.58 - 2.54 - Direnç:2.675 - 2.71 - 2.74 -