BRNUSD
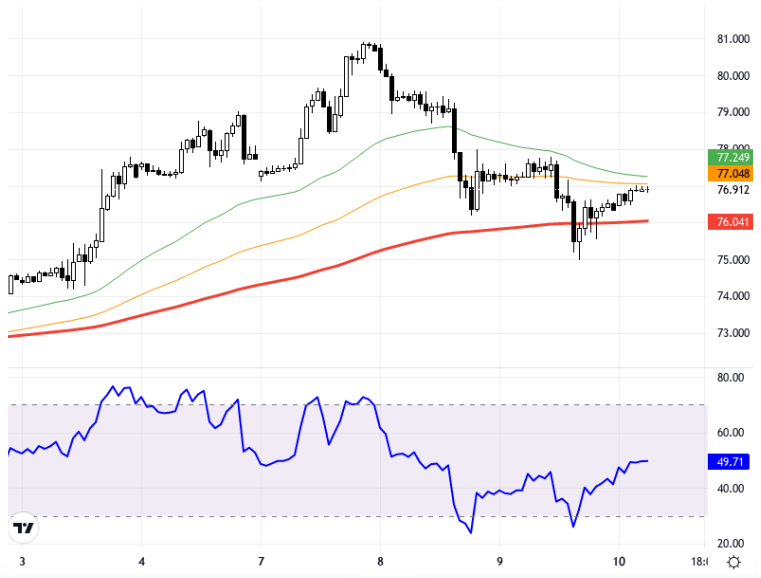
Brent crude oil prices have largely preserved their gains from Middle Eastern risk factors, despite minor declines due to unmet expectations from China. The absence of further economic stimulus in China, in particular, has led to disappointment in the markets. This situation affects the economic outlook in China and other major economies, shaping expectations for oil prices. The impact of American employment data and the policies of the Central Bank on Brent crude is also being closely monitored. From a technical analysis perspective, Brent crude oil prices have been examined on the 1-hour chart timeframe. Prices are attempting to hold above the support zone of 78.50 – 79.00. In upward movements, the resistance levels of 80.00 and 80.50 should be watched. In downward movements, the 78.50 level stands out as a critical support, and if this level is broken, a pullback towards the levels of 78.00 and 77.50 may be observed. The RSI indicator is at 52, showing a neutral trend. The current price is at 79.42, with a minor decrease of 0.01% from the previous day. Support:76.5 - 76 - 75.5 - Resistance:77.5 - 78 - 78.5 -
Brent Petrol fiyatları, Çin'den gelen beklentilerin karşılanmaması ile oluşan küçük gerilemelere rağmen, Orta Doğu kaynaklı risklerle oluşan kazanımlarını büyük ölçüde korumuş durumda. Özellikle Çin'deki son ekonomik teşviklerin devamının gelmemesi, piyasalarda hayal kırıklığı yarattı. Bu durum, Çin ve diğer büyük ekonomilerdeki ekonomik görünümü etkileyerek petrol fiyatlarına yönelik beklentileri şekillendirmekte. Amerikan istihdam verileri ve Merkez Bankası politikalarının da Brent Petrol üzerindeki etkisi yakından izlenmekte. Teknik analiz açısından, Brent Petrol fiyatları 1 saatlik grafik zaman diliminde incelenmiştir. Fiyatlar, 78,50 – 79,00 destek bölgesinin üzerinde tutunmaya çalışıyor. Yukarı hareketlerde 80,00 ve 80,50 direnç seviyeleri takip edilmelidir. Aşağı yönlü hareketlerde ise, 78,50 seviyesi kritik bir destek olarak öne çıkıyor ve bu seviyenin kırılması durumunda 78,00 ve 77,50 seviyelerine doğru bir geri çekilme gözlemlenebilir. RSI göstergesi 52 seviyesinde olup, nötr bir eğilim sergiliyor. Mevcut fiyat 79,42 seviyesindedir ve bir önceki güne göre %0,01'lik küçük bir düşüş görülmektedir. Destek:76.5 - 76 - 75.5 - Direnç:77.5 - 78 - 78.5 -