EURUSD
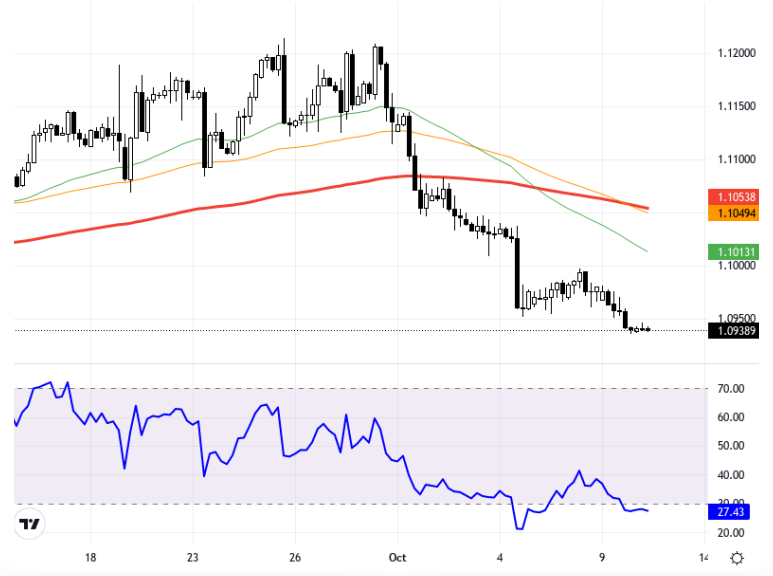
The EURUSD pair is trying to find direction with the expected inflation data from the US and the Federal Reserve's interest rate policy expectations. While headline inflation in the US is expected to decrease on an annual basis, core inflation is anticipated to remain the same. During this process, the strengthening tendency of the US Dollar could increase the downward pressure on the EURUSD pair. The strong stance of the US Dollar Index continues to exert pressure on the EURUSD and other major market currencies. Technically, when the 4-hour chart is examined, the EURUSD pair is trading below the 1.0990 - 1.1040 region, indicating that the downward pressure might continue. There is potential for the pair to decline towards the support levels at 1.0940, 1.0905, and further to 1.0870. Among these levels, 1.0905 can be observed as a critical support. The RSI indicator is at the 27.40 level, in the oversold zone, displaying a negative outlook. While the daily change shows a decrease of 0.02%, the current price is around 1.0938. If a recovery is observed from these levels, attention can be paid to the resistance areas of 1.0990 - 1.1040. Support:1.0905 - 1.087 - 1.083 - Resistance:1.099 - 1.104 - 1.11
EURUSD paritesi, ABD'de beklenen enflasyon verileri ve Fed'in faiz politikası beklentileriyle yön bulmaya çalışıyor. ABD'de manşet enflasyonun yıllık bazda düşmesi beklenirken, çekirdek enflasyonun aynı kalması öngörülüyor. Bu süreçte ABD Doları'nın güçlenme eğilimi, EURUSD paritesinde aşağı yönlü baskıyı artırabilir. ABD Dolar Endeksi'nin güçlü duruşu, EURUSD ve diğer gelişmiş piyasa para birimleri üzerindeki baskıyı devam ettiriyor. Teknik olarak 4 saatlik grafik incelendiğinde, EURUSD paritesi 1,0990 - 1,1040 bölgesi altında seyrediyor ve bu durum, aşağı yönlü baskının sürebileceğini gösteriyor. Paritenin 1,0940, 1,0905 ve devamında 1,0870 destek seviyelerine doğru gerileme potansiyeli bulunmakta. Bu seviyelerde özellikle 1,0905 kritik bir destek olarak izlenebilir. RSI göstergesi 27.40 seviyesinde, aşırı satım bölgesinde yer alarak negatif bir görünüm sergiliyor. Günlük değişim %0.02'lik bir düşüşü işaret ederken, anlık fiyat 1.0938 seviyelerinde. Bu seviyelerden bir toparlanma görülürse, direnç olarak 1,0990 - 1,1040 bölgelerine dikkat edilebilir. Destek:1.0905 - 1.087 - 1.083 - Direnç:1.099 - 1.104 - 1.11 -