DAXEUR
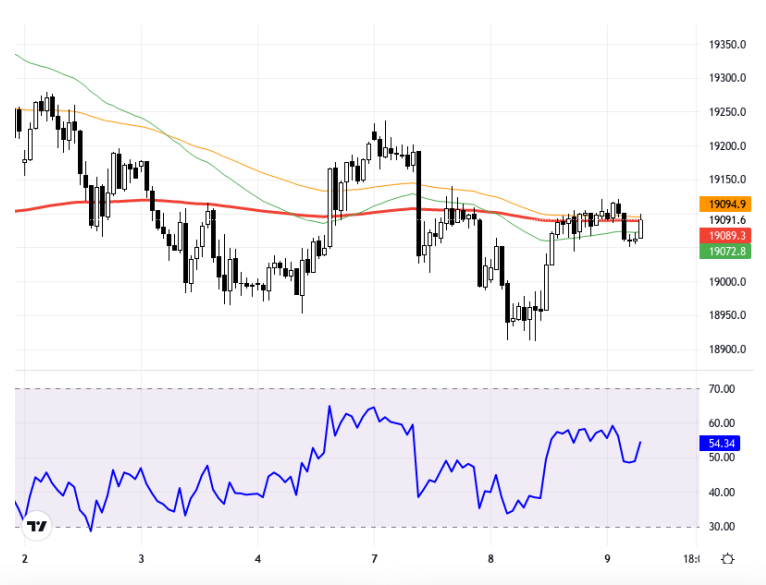
The DAX40 index continues its downward trend despite the mixed outlook in European markets. Among European indices, the pressure on DAX40 is noticeable, unlike many other indices. This situation contrasts with the general trend of European stock markets, which are positive aside from Germany and the Netherlands. The index remaining below the 13 and 34- period averages suggests that the current weakness might persist. In this environment, attention is focused on the 19200-19250 range; it is considered that the downward pressure may continue until these levels are surpassed. Technically, the DAX40 index is observed on a 1-hour timeframe and is currently trading at the 18996 level. Resistance is at 19094 and 19108 levels, while support is at 18960, 18885, and 18780 levels. The 18885 level is prominent, and falling below it may lead to a deepening of the negative trend. The RSI indicator is at 34.92 and close to the oversold area, indicating a negative outlook in the market. Additionally, the index has depreciated by 0.14% compared to the previous day. Support:19350 - 19278 - 19195 - Resistance:19465 - 19545 - 19660-
DAX40 endeksi, Avrupa piyasalarındaki karışık görünüme rağmen düşüş eğilimini sürdürüyor. Avrupalı endeksler arasında, diğer birçok endeksin aksine, DAX40'taki baskı dikkat çekici. Bu durum, Almanya ve Hollanda dışında pozitif seyir gösteren Avrupa borsalarının genel eğilimine tezat oluşturuyor. Endeksin 13 ve 34 periyotluk ortalamaların altında seyrini sürdürmesi, mevcut zayıflığın devam edebileceğine işaret ediyor. Bu ortamda, dikkatler 19200-19250 bandına odaklanmış durumda; bu seviyeler aşılana kadar aşağı yönlü baskının devam edebileceği değerlendiriliyor. Teknik açıdan, DAX40 endeksi 1 saatlik zaman diliminde gözlemlenmekte olup, şu an 18996 seviyesinde işlem görmekte. Dirençler 19094 ve 19108 seviyelerinde, destekler ise 18960, 18885 ve 18780 seviyelerinde yer alıyor. 18885 seviyesi öne çıkarken, bu seviyenin altına inilmesi negatif trendin derinleşmesine neden olabilir. RSI göstergesi 34.92 seviyesinde ve aşırı satım bölgesine yakın seyrederek piyasada negatif bir görünüm sergiliyor. Ayrıca endeks, önceki güne kıyasla %0,14 değer kaybetmiş durumda. Destek:19350 - 19278 - 19195 - Direnç:19465 - 19545 - 19660 -